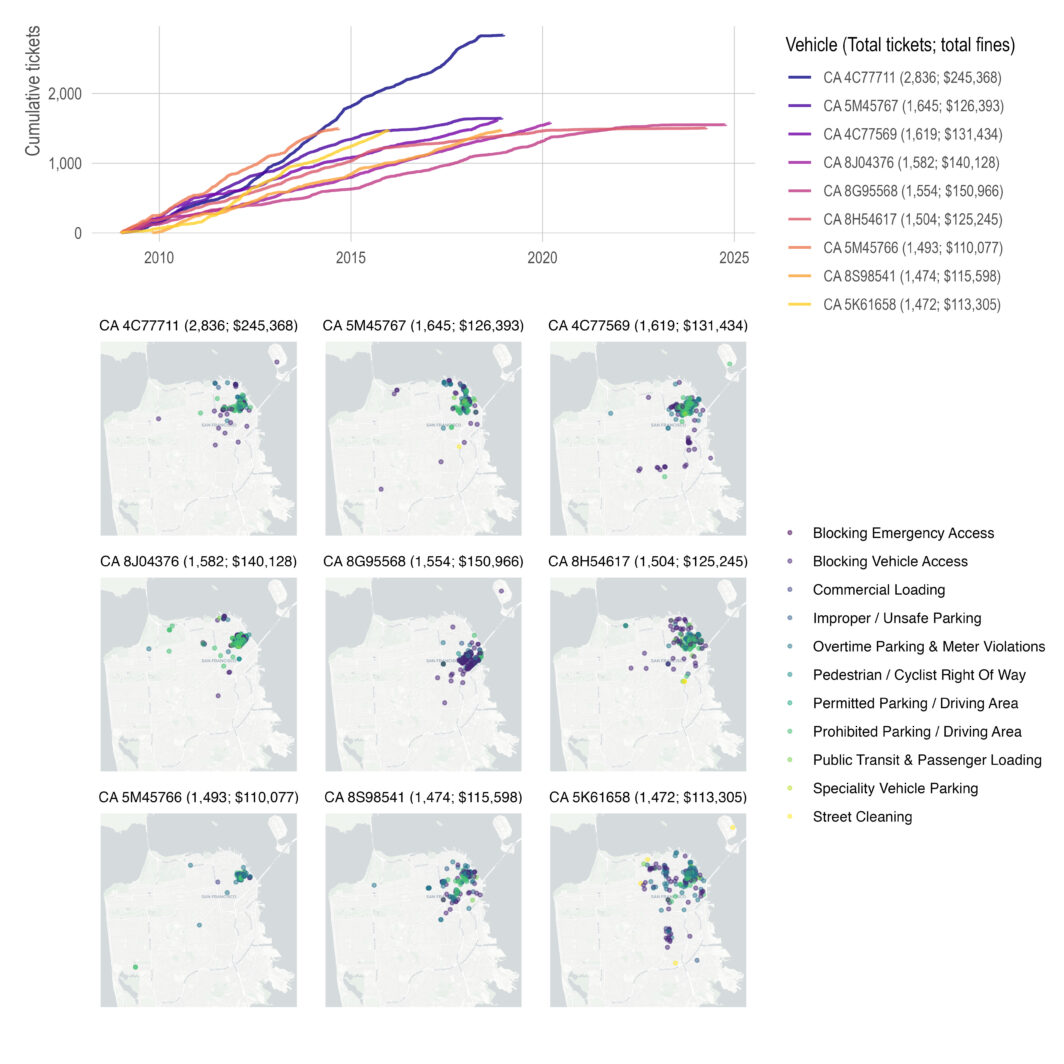
an Francisco issues about 5,000 parking citations per day, resulting in over 21.4 million parking citations to over 5.2 million unique license plates since January 2008. That’s a pretty astounding number of parking citations when you consider San Francisco is home to less than a million people, less than half a million registered cars, and covers an area that’s just 7 miles by 7 miles. Parking citations are handled by San Francisco MTA while moving violations are handled by the San Francisco Police Department, which has a well–documented habit of not enforcing (even dangerous) vehicle violations — resulting in about …
Comparing daily (direct) COVID-19 deaths to other causes of death
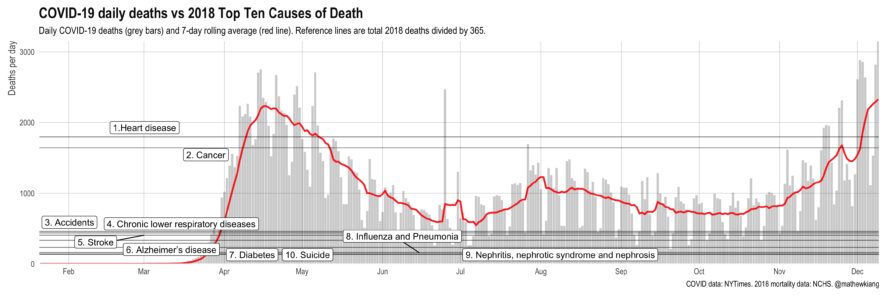
t’s easy to get numb at this stage of the pandemic, but a friendly reminder that daily COVID-19 (direct) deaths have been consistently higher than 8 of the top 10 causes of death (in 2018) since April. We’re on track for over 3,000 deaths per day by Christmas (!!) — things are not good.
Applying an intro-level networks concept to deleting tweets
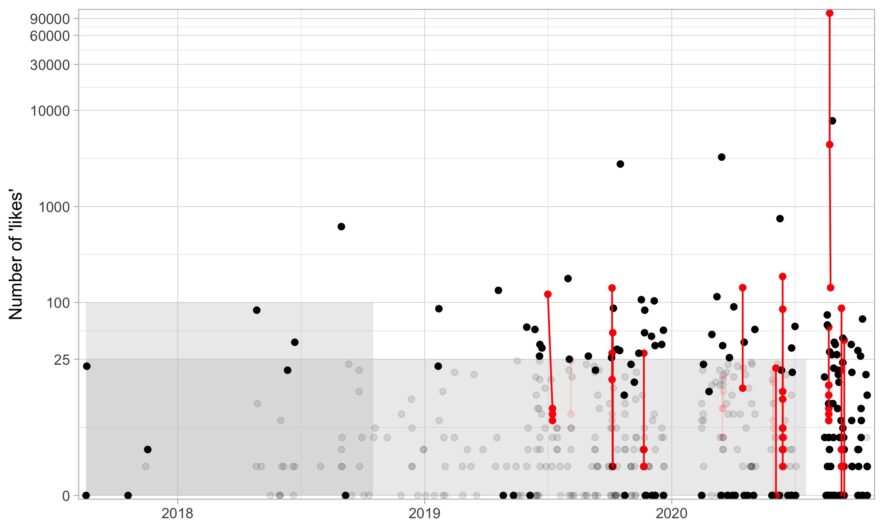
here are a few services out there that will delete your old tweets for you, but I wanted to delete tweets with a bit more control. For example, there are some tweets I need to keep up for whatever reason (e.g., I need it for verification) or a few jokes I’m proud of and don’t want to delete. If you just want the R code to delete some tweets based on age and likes, here it is (noting that it is based on Chris Albon’s Python script). In this post, I go over a bit of code about what I …
Using a histogram as a legend in choropleths
espite well known drawbacks,1 plotting parameters onto maps provides a convenient way of seeing context, patterns, and outliers. However, one of the many problems with choropleths is that the area of the regions tend to distort our perception of the value of the region. For example, in the United States, huge (in terms of land mass) counties will tend to have a greater visual impact than small counties (despite often having similar or even smaller population sizes). One way to address this is to use a histogram as a legend on your map. The histogram then provides you with a way …