Analyzing San Francisco’s parking citation data
San Francisco issues about 5,000 parking citations per day, resulting in over 21.4 million parking citations to over 5.2 million unique license plates since January 2008. That’s a pretty astounding number of parking citations when you consider San Francisco is home to less than a million people, less than half a million registered cars, and covers an area that’s just 7 miles by 7 miles. Parking citations are handled by San Francisco MTA while moving violations are handled by the San Francisco Police Department, which has a well–documented habit of not enforcing (even dangerous) vehicle violations — resulting in about a 90% drop in citations since 2019.
Last week, I nearly got killed by a person running a (blatantly) red light. Ironically, it happened in front of where I live — literally one block from a police station. Thankfully, the person had a fairly memorable license plate so I went home and found the person had over two dozen parking citations in 2024 alone.
I decided to take a closer look at the data (helpfully provided by DataSF) and ended up going down a little rabbit hole. Come join me.
Overall trends in parking citations
The majority of parking citations are for street cleaning (8.1M) or meter violations (6.6M), which account for about 70% of all parking citations from 2008 through 2024. A couple of things to note: (1) the plot (as do all plots in this post) starts in 2009 because data in 2008 does not appear complete and (2) November 2009 is missing (and this is verified to be missing in the raw data as well)).
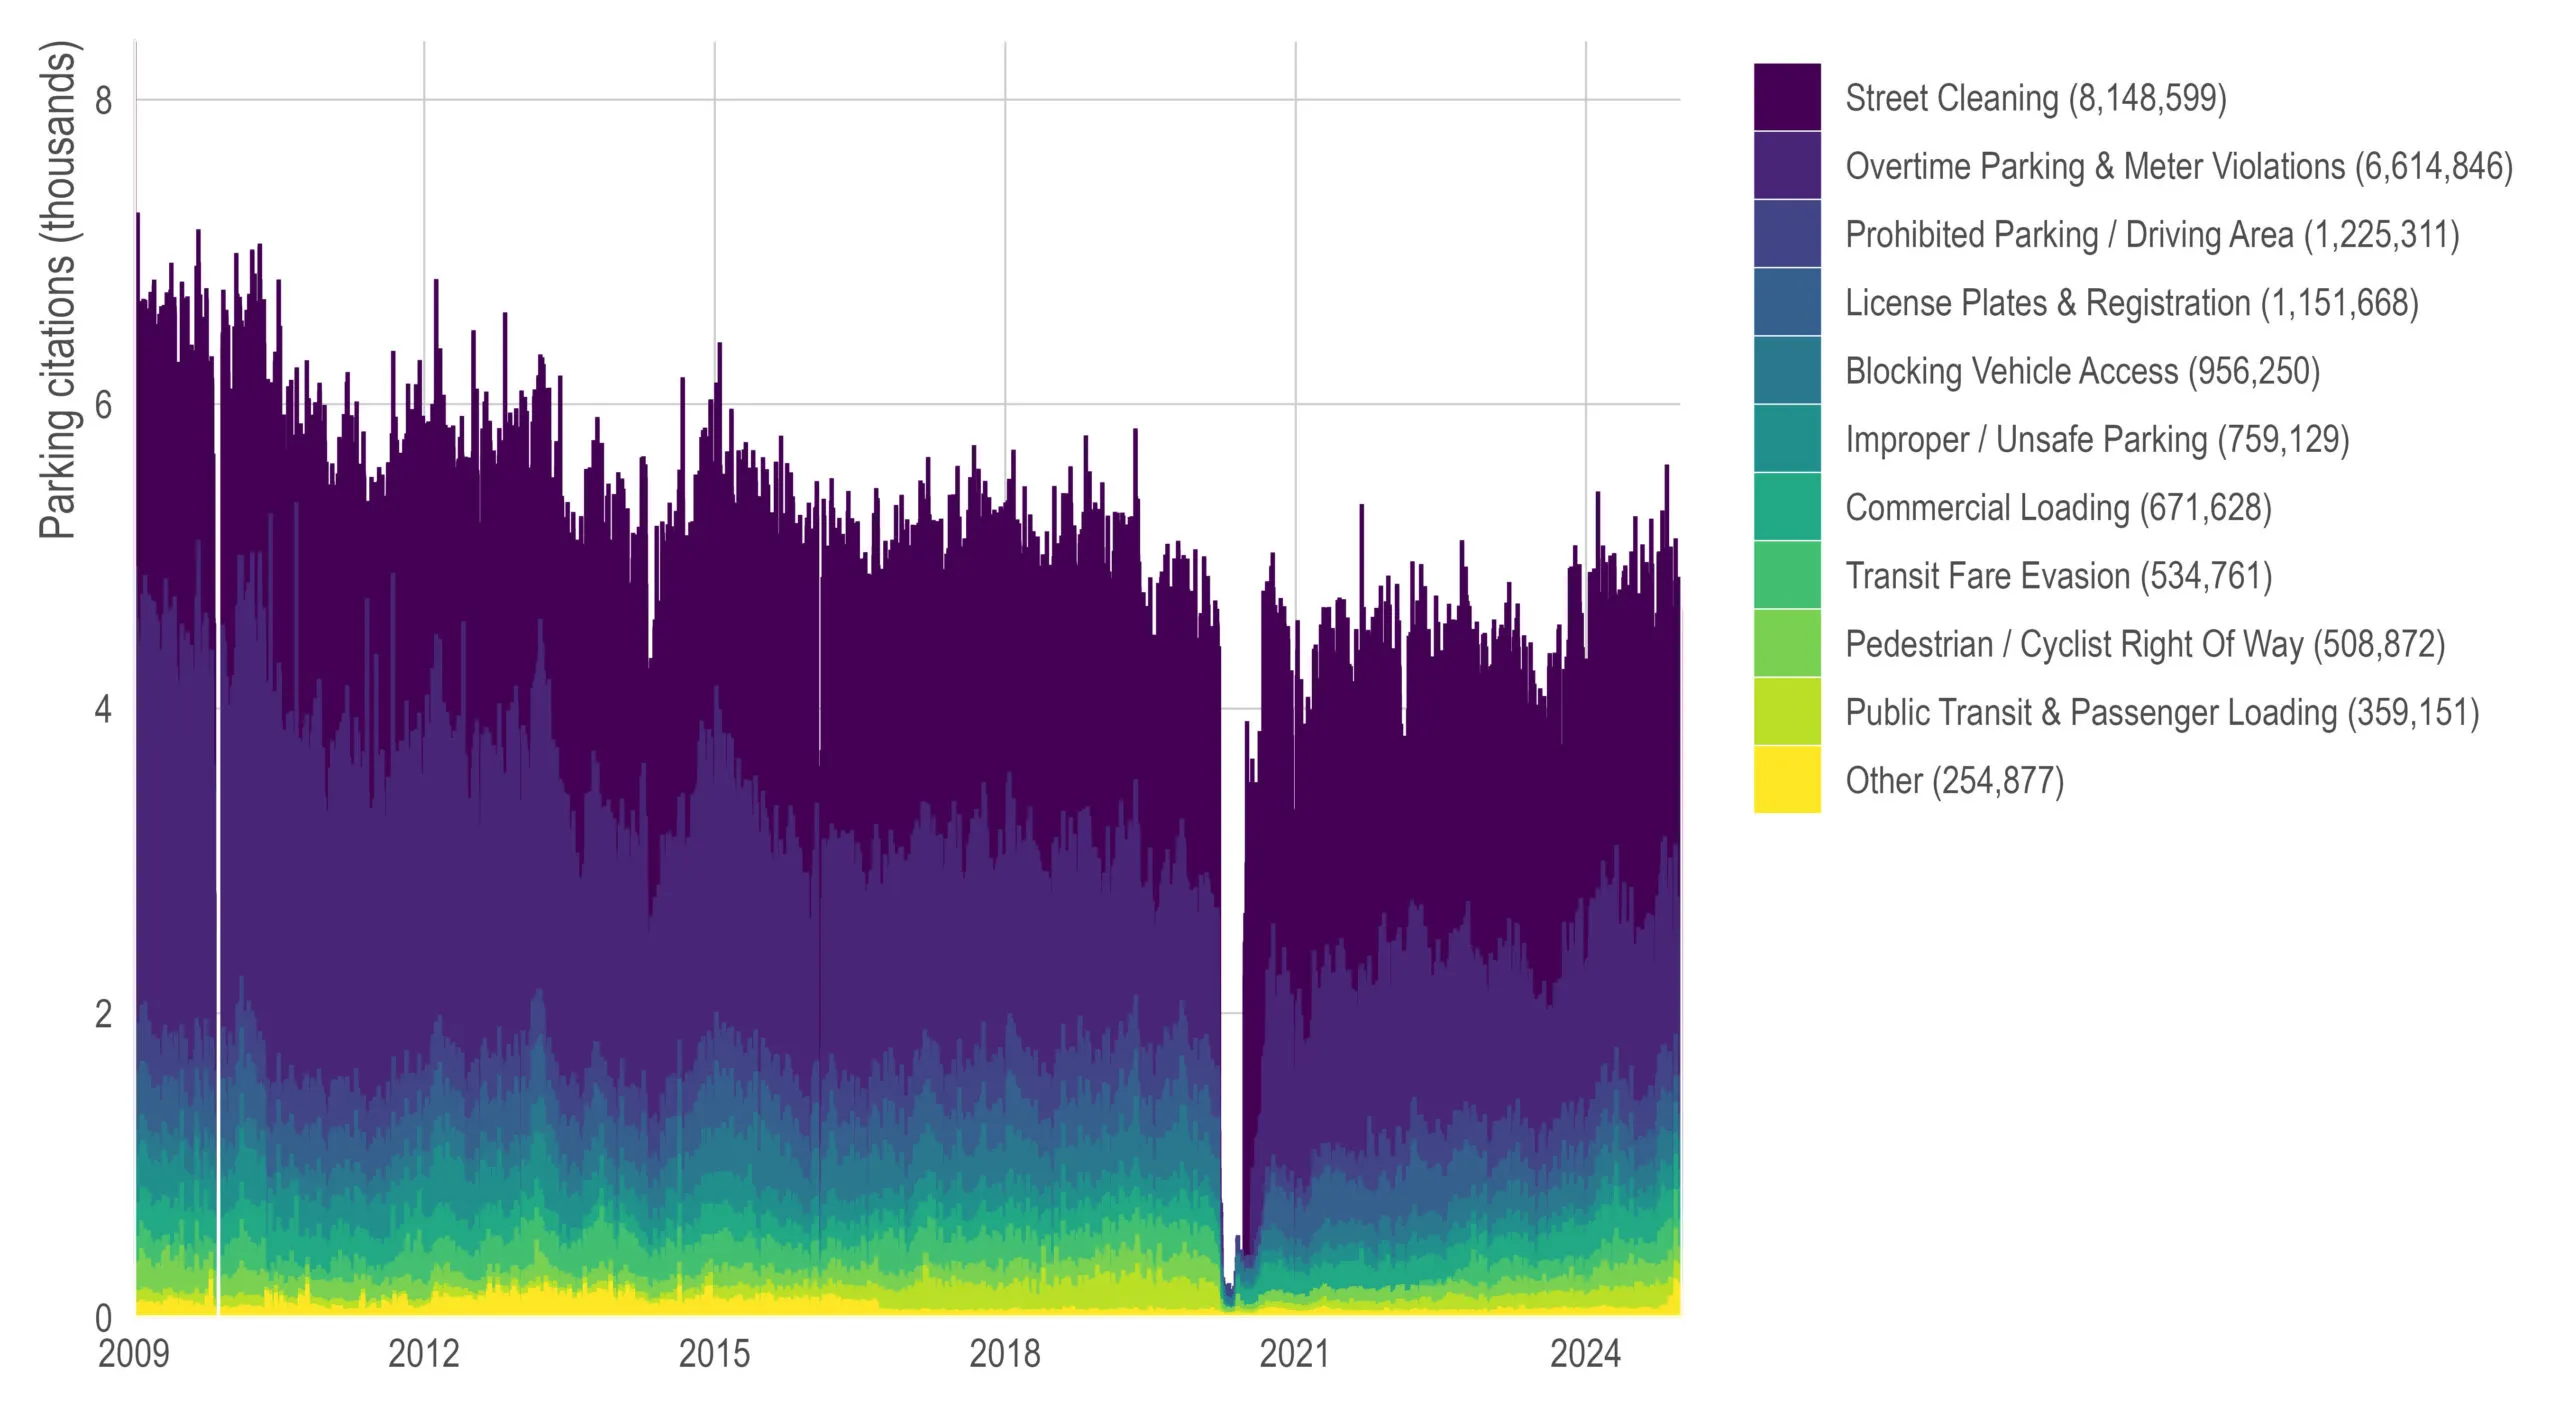
Note how the COVID-19 pandemic massively dropped enforcement and/or citations. I don’t show it here but the drop begins the week of March 16th, 2020 (the day of the Bay Area shelter-in-place order). On March 16th, 2020, there were about 4,200 citations and by March 19th it dropped to 971, continuing to drop until it hit 98 on March 29th.
Temporal patterns in parking citations
Most parking citations happen between 12pm and 1pm on weekdays and there are substantially fewer citations on weekends. Whether or not this is due to lower enforcement, fewer violations, or a mix of both is unclear from the data, but if you had to pick a time and day to park illegally, it would be Sunday at 5am.
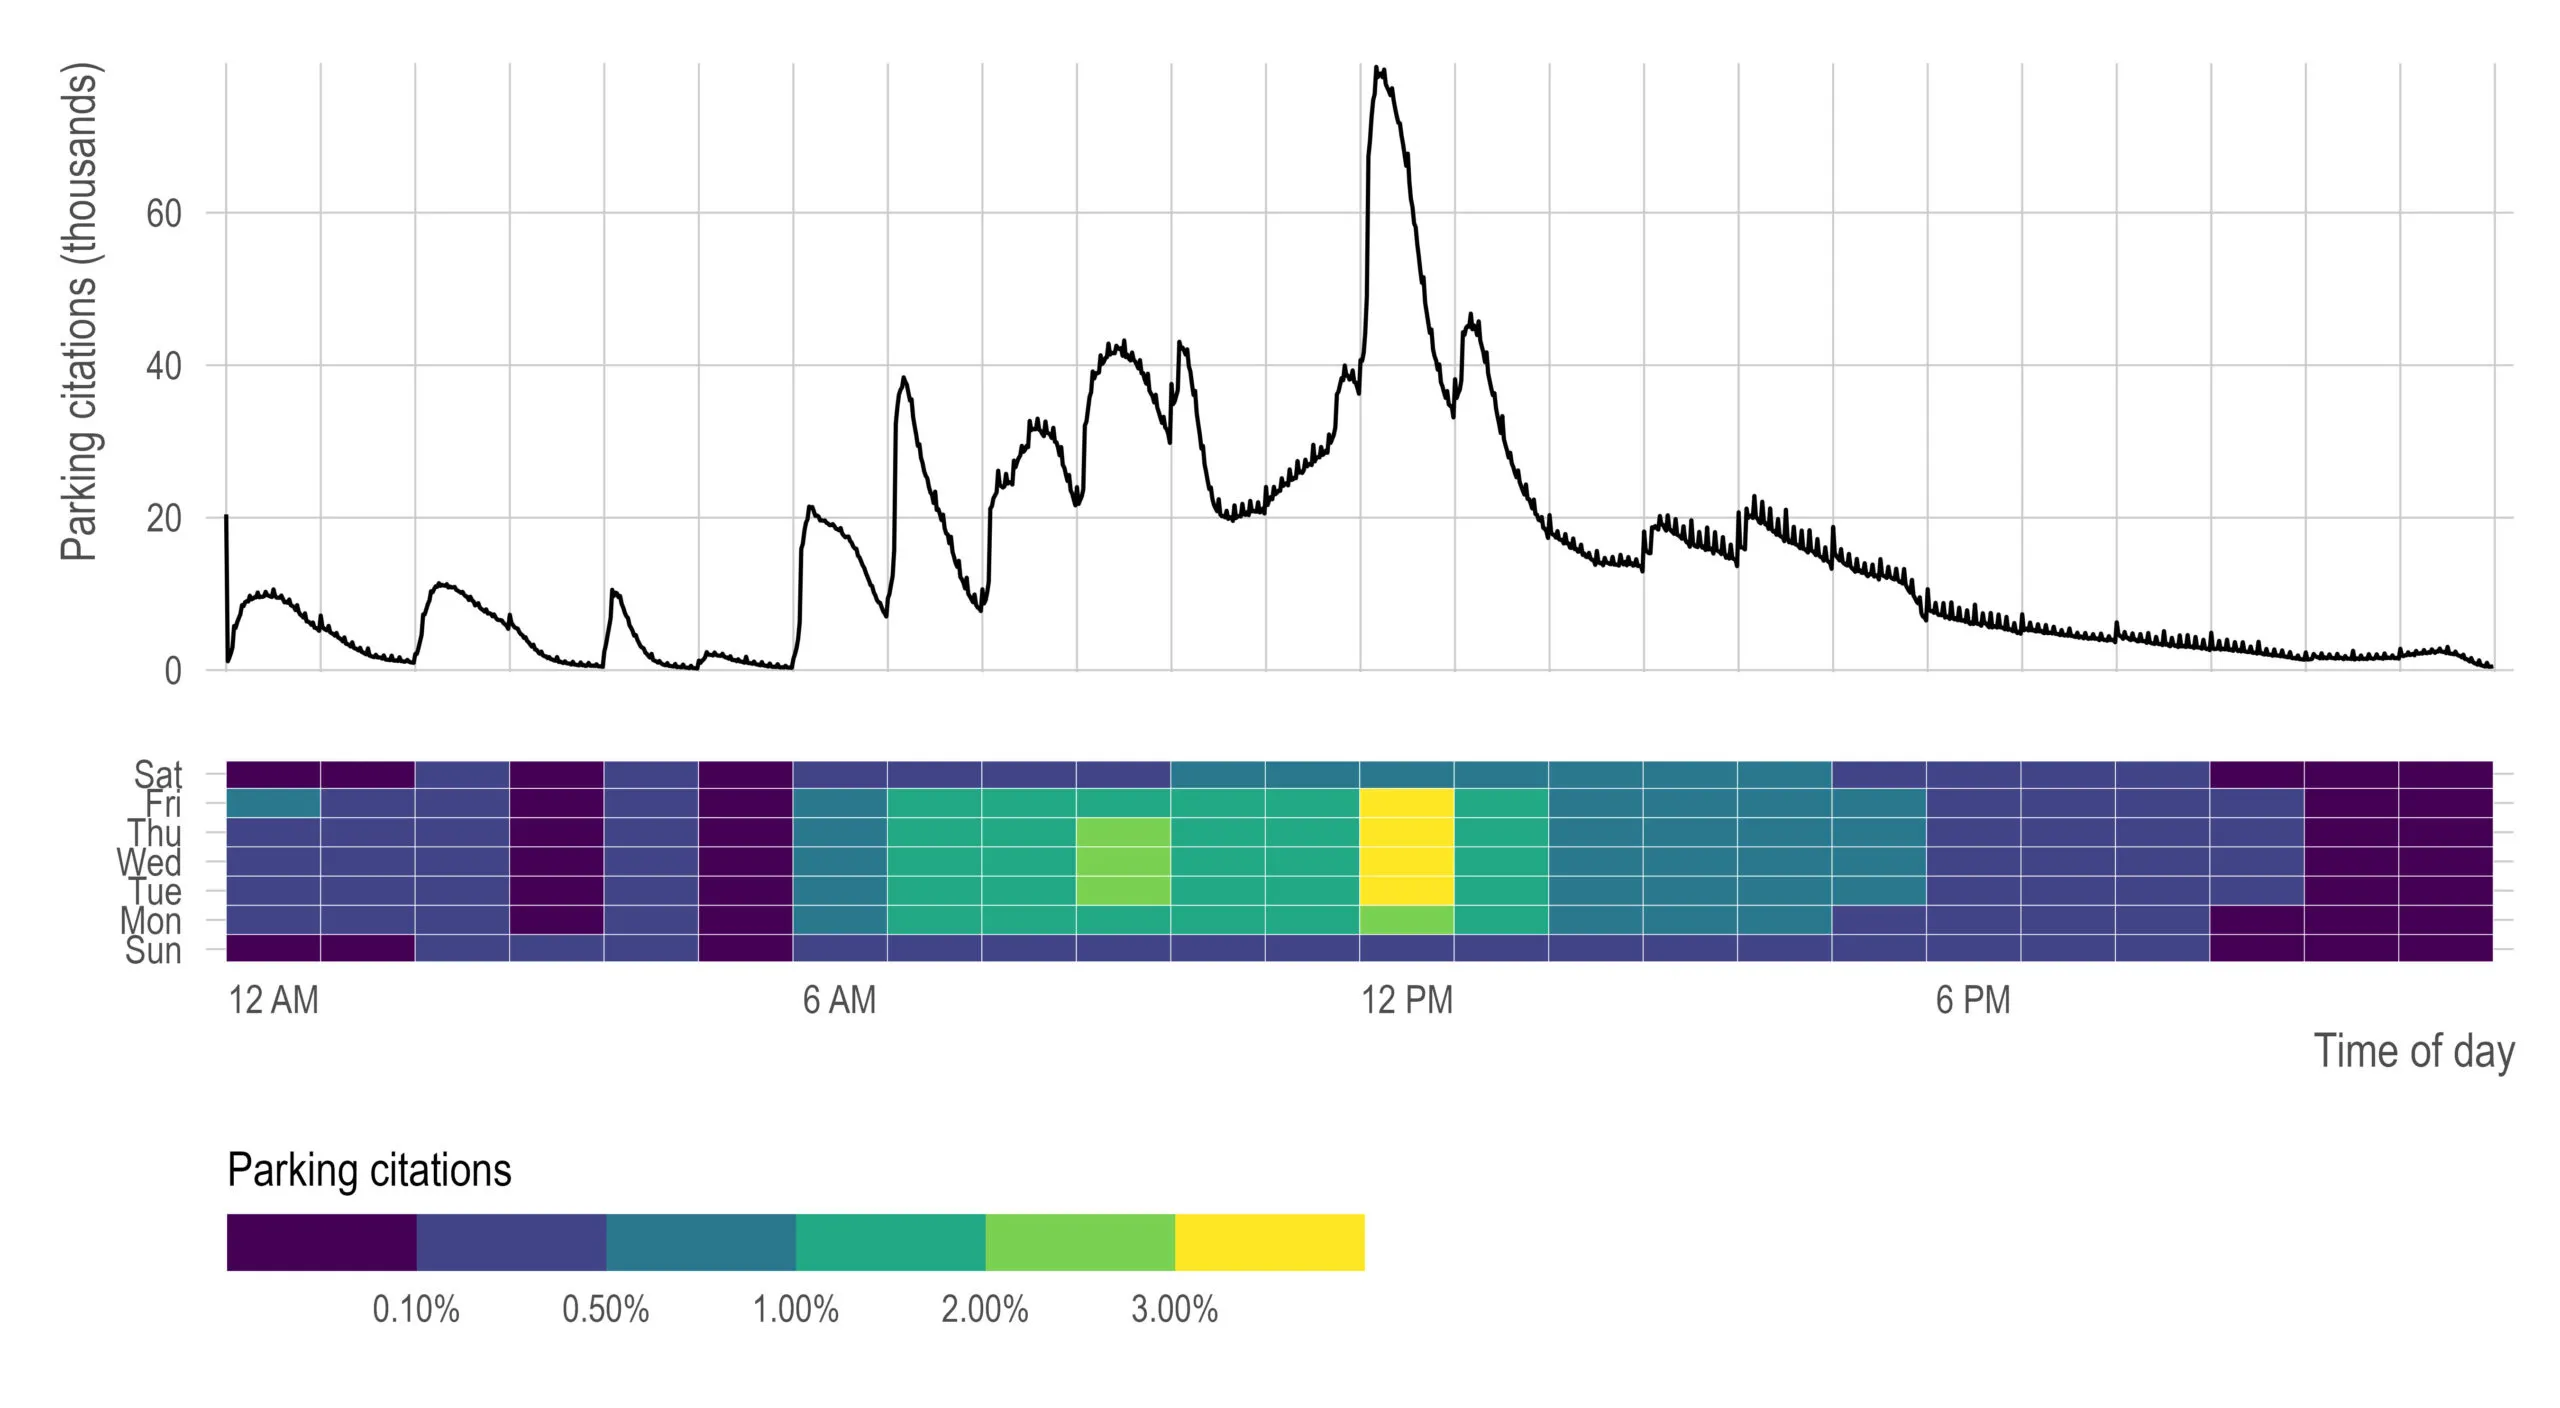
In my opinion, the most interesting thing about this plot is what happens within the hour. It’s less in clear in some hours (e.g., 2am), but very clear in the afternoon hours that enforcement officers like to round the time to the nearest 0 or 5. This is (I assume) the same phenomenon that occurs with age heaping when people in the US like to round their age to a number that ends in 0 or 5. (Side note, interestingly, other countries age heap around other numbers.)
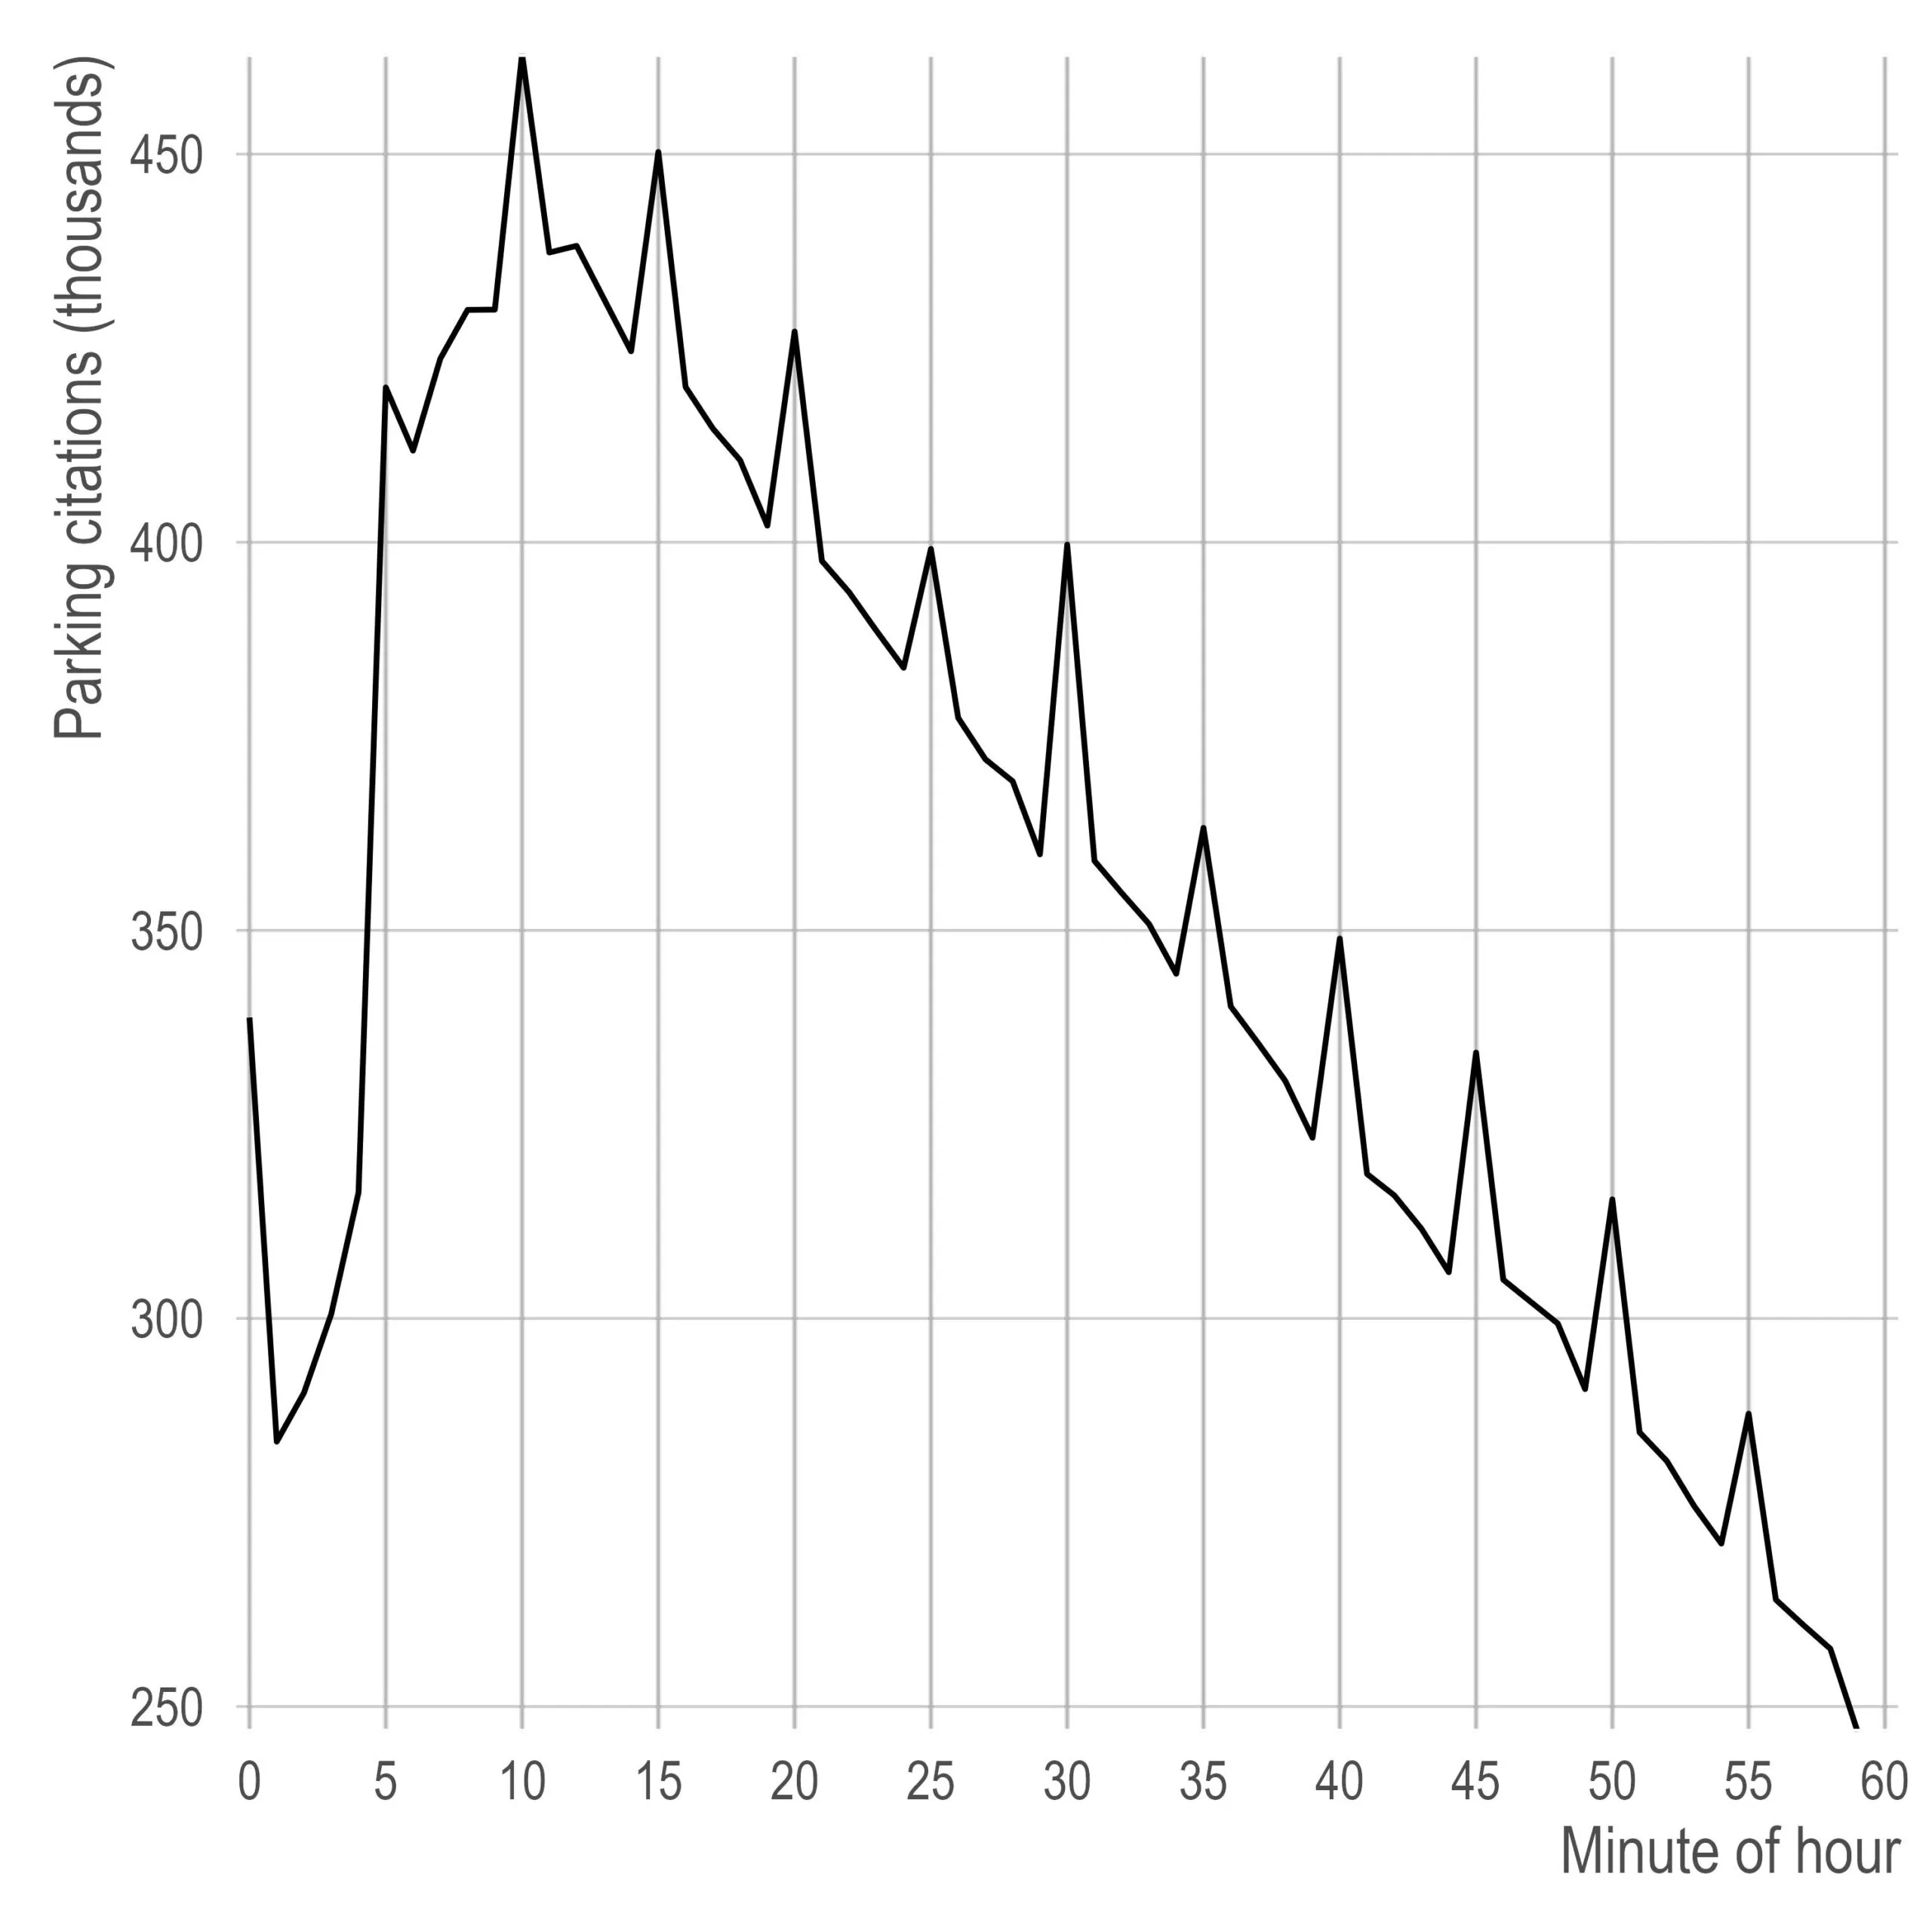
The other interesting thing that occurs is it seems like for most hours, you are much more likely to get a ticket earlier in the hour. There is no clear mechanism I can think of for this to occur (e.g., more possible violations earlier in an hour). If I aggregate across all days and hours (focusing only on the minute of the hour), this trend is much clearer — you’re most likely to get a ticket at the 10 minute mark and then it steadily (and linearly) decreases from there.
Parking citations are unequally distributed
Below, I plot the proportion of vehicles (on the x-axis) that account for the proportion of citations (on the y-axis). For example, in 2024, the top 0.1% (about 500 vehicles) accounted for 3% of all tickets. Similarly, the top 1% accounted for 12% of all tickets, the top 5% accounted for ~30% of all tickets. In fact, just 15% of all cited drivers (about 80,000 of the 510,000 unique vehicles that were cited) accounted for half of all parking citations.
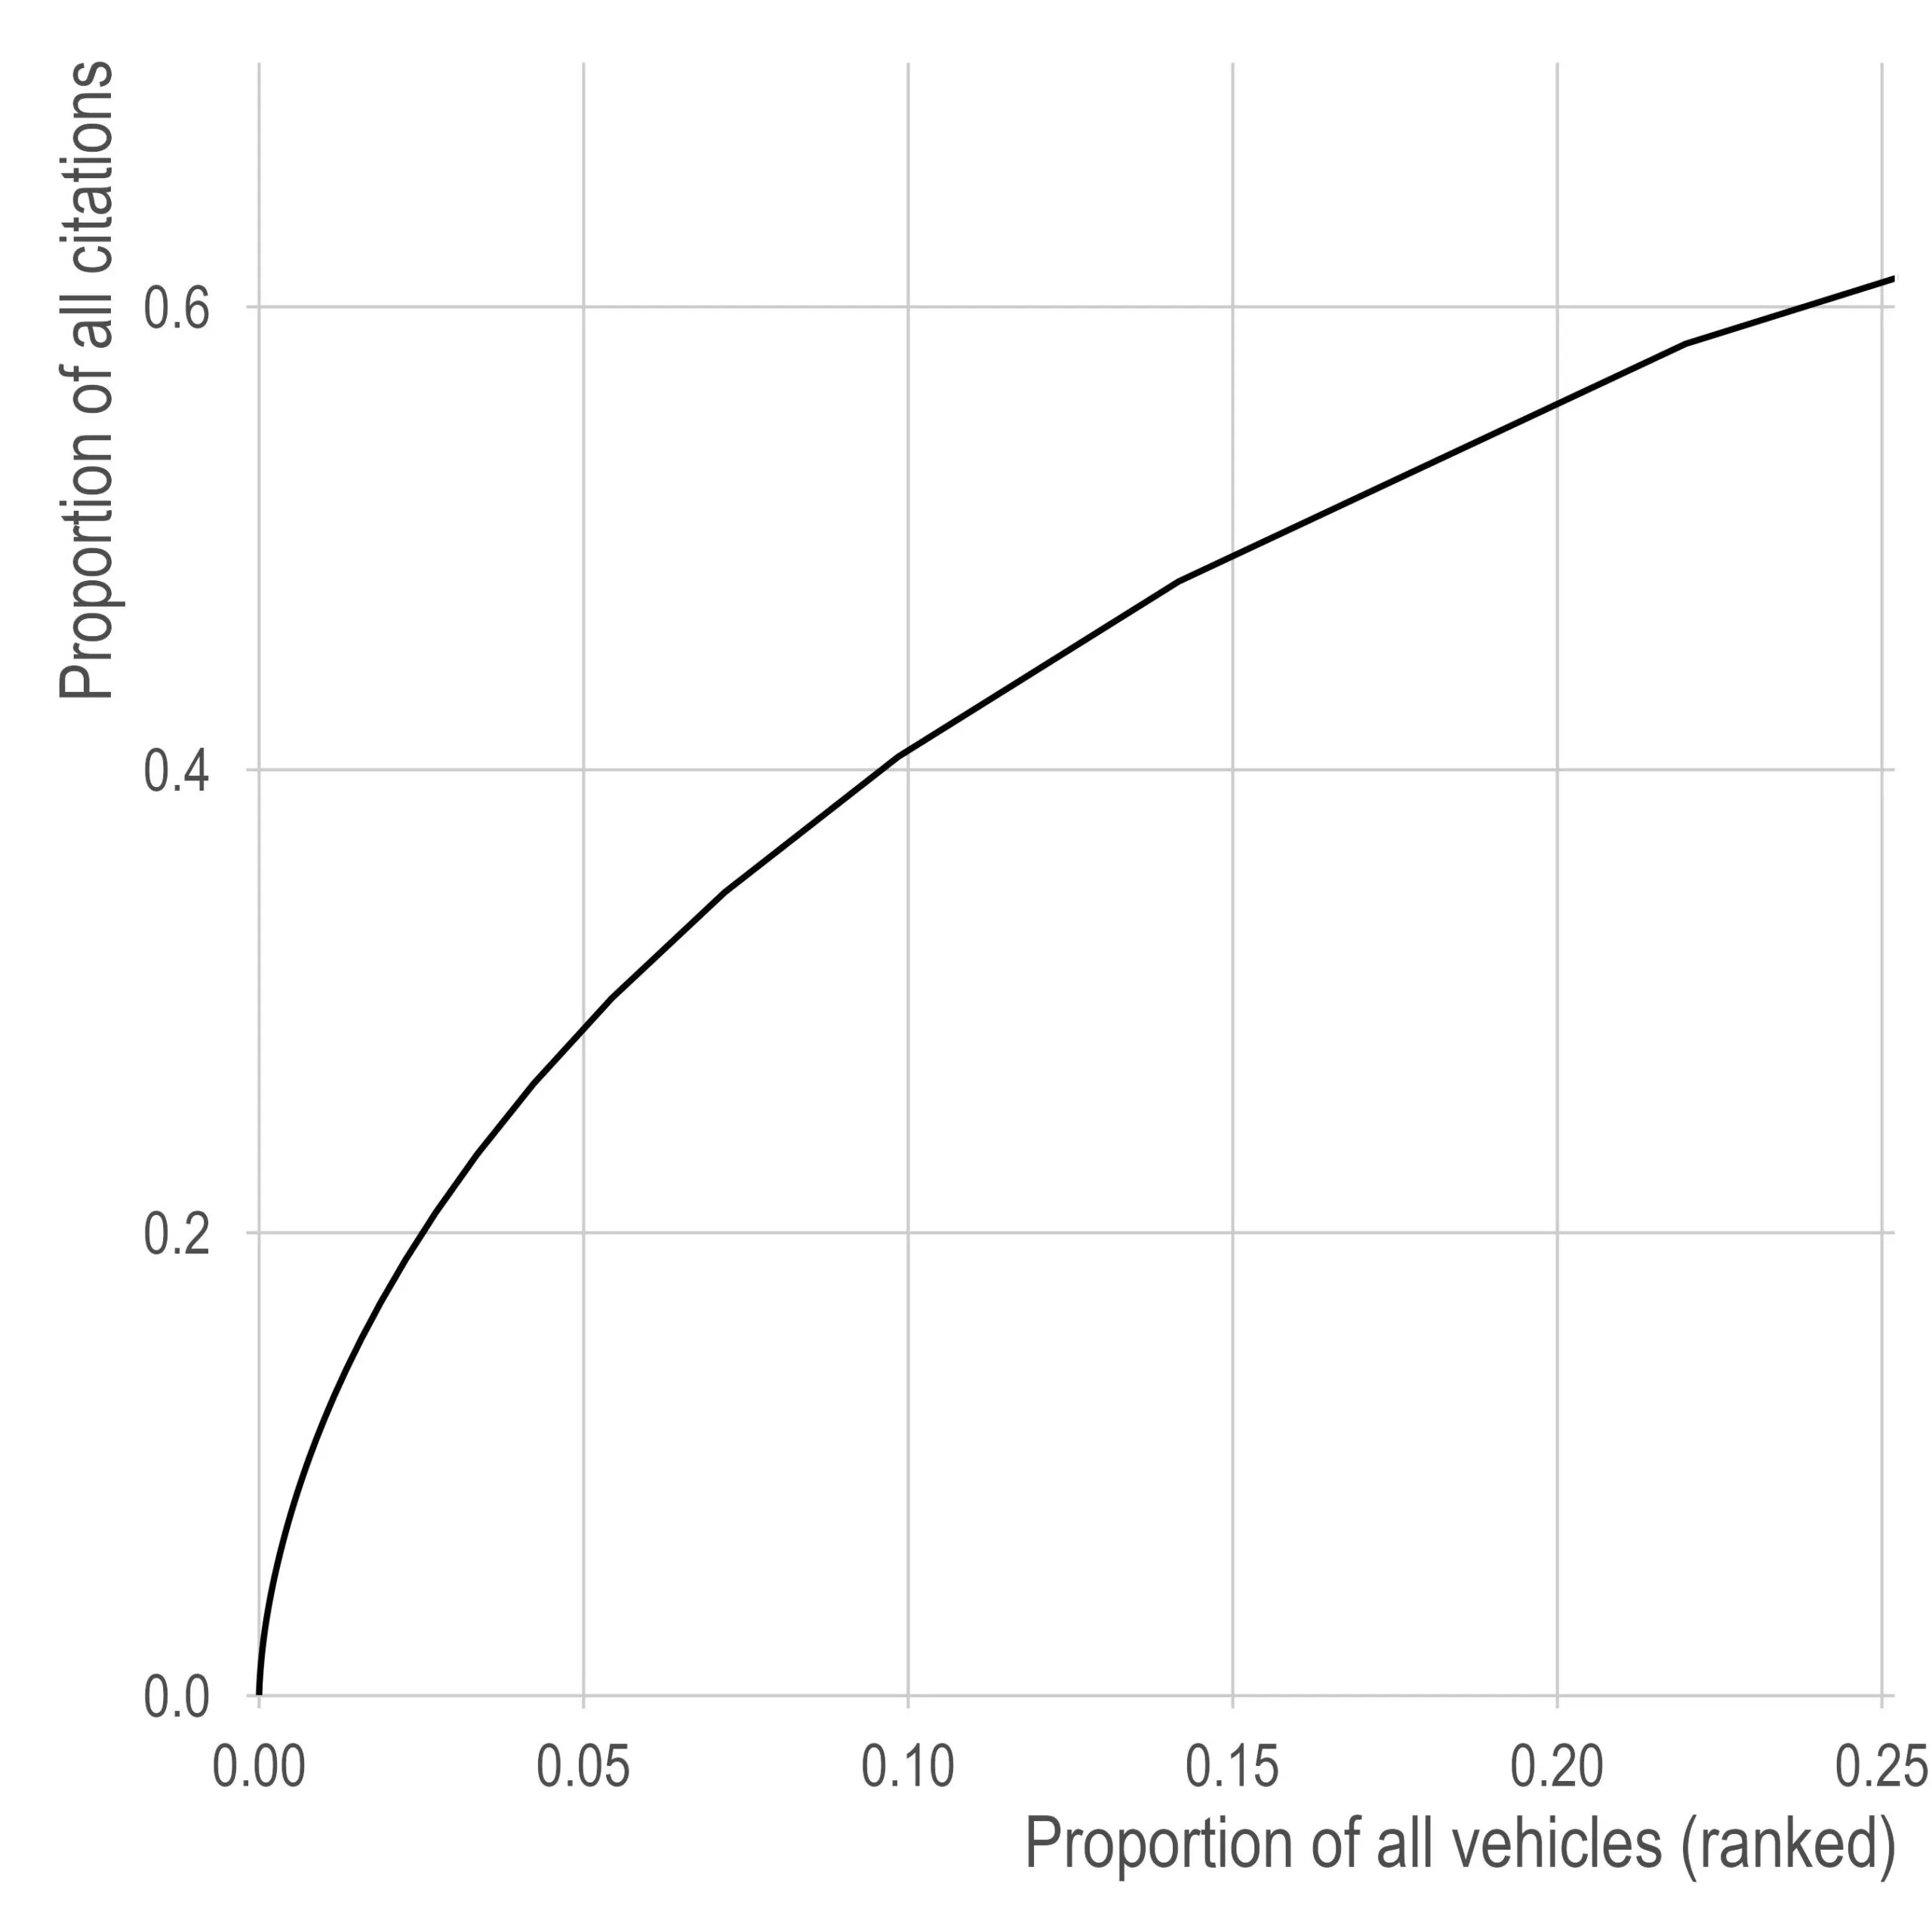
This is a pretty wild distribution. It’s not surprising from a behavioral standpoint — at some point, getting another parking ticket is not going to matter to you so the type of person that gets 10 parking tickets is probably also the type of person that gets 50 parking tickets. But just from a sheer numbers perspective, it’s pretty shocking.
For example, one license plate in the data set accounted for nearly a quarter million dollars in fines (from about 2,800 citations). Below, I plot the top nine violators in the data along with where their citations were more likely to occur (conditional on location data being available, which is not always the case with recent years).
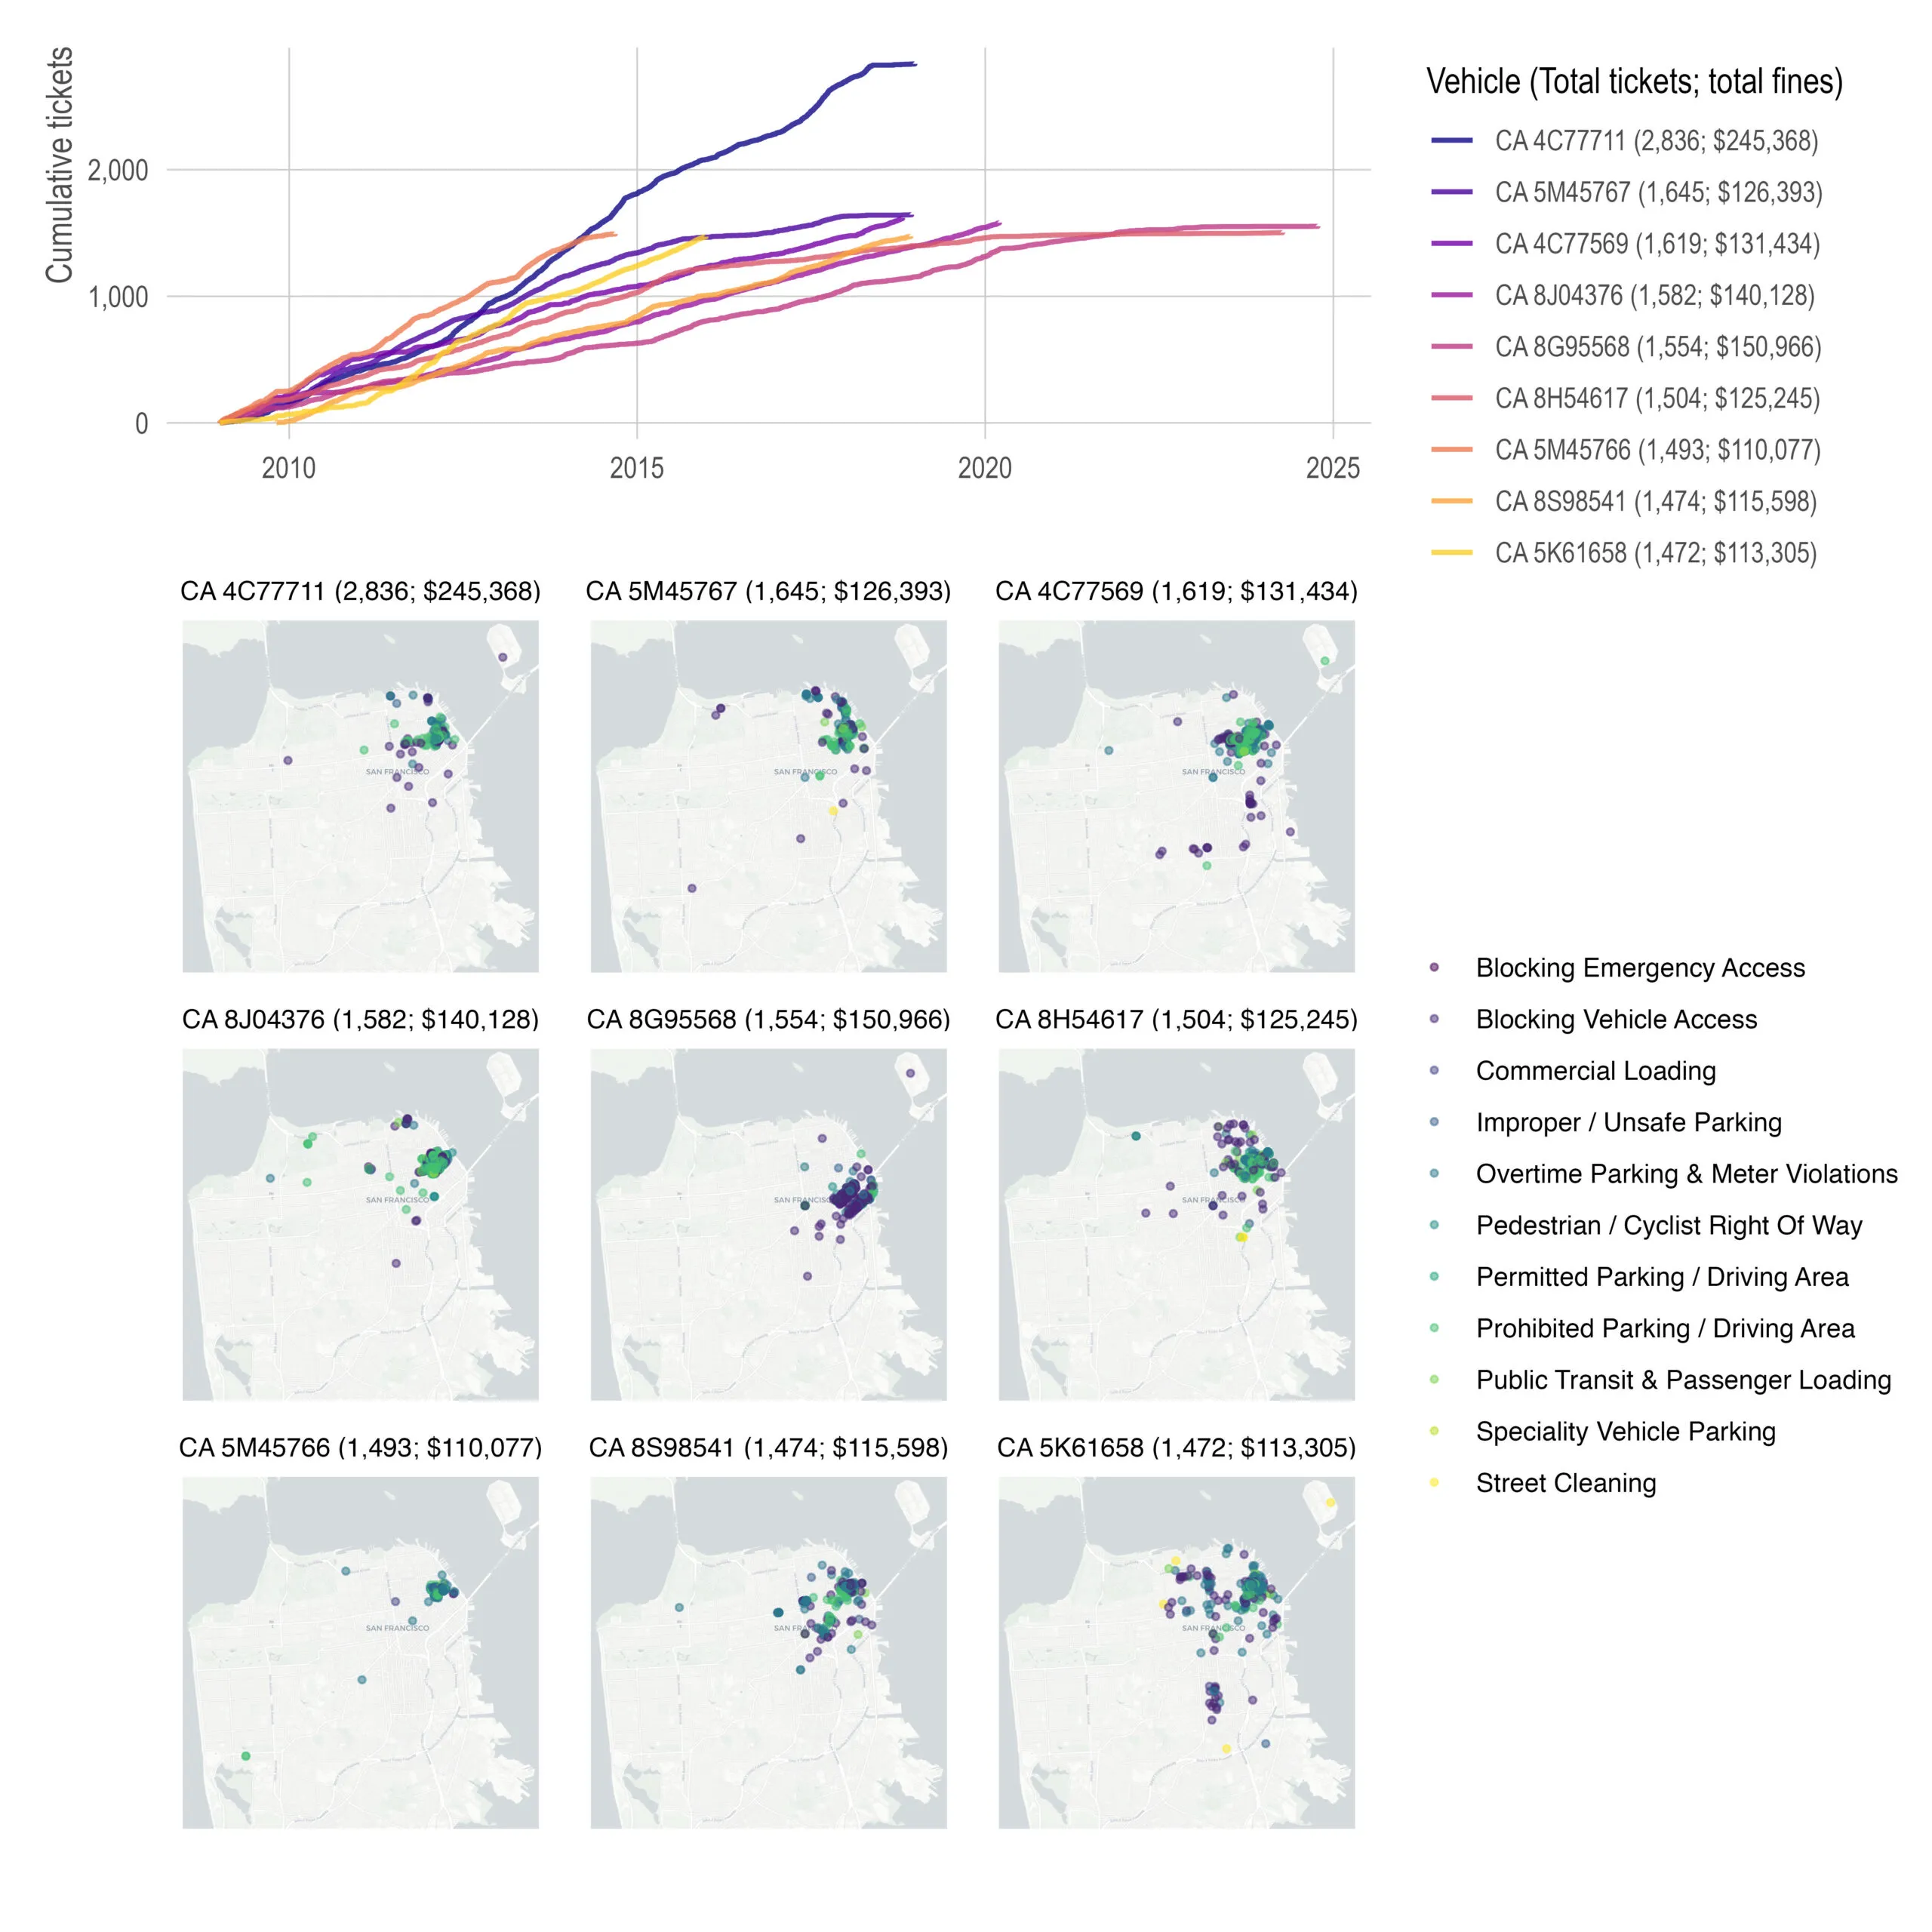
Nearly all citations given to the top violators occur in downtown San Francisco, which is not super surprising — there is both greater density and more opportunities for violations to occur. I assume most of these drivers have jobs that require them to work in downtown and they simply can’t be bothered to find parking. Two drivers, 8G95568 and 5K61658, have slightly different citation patterns than the others. Getting cited more often in different areas (north of Market vs south of Market) and for different reasons.
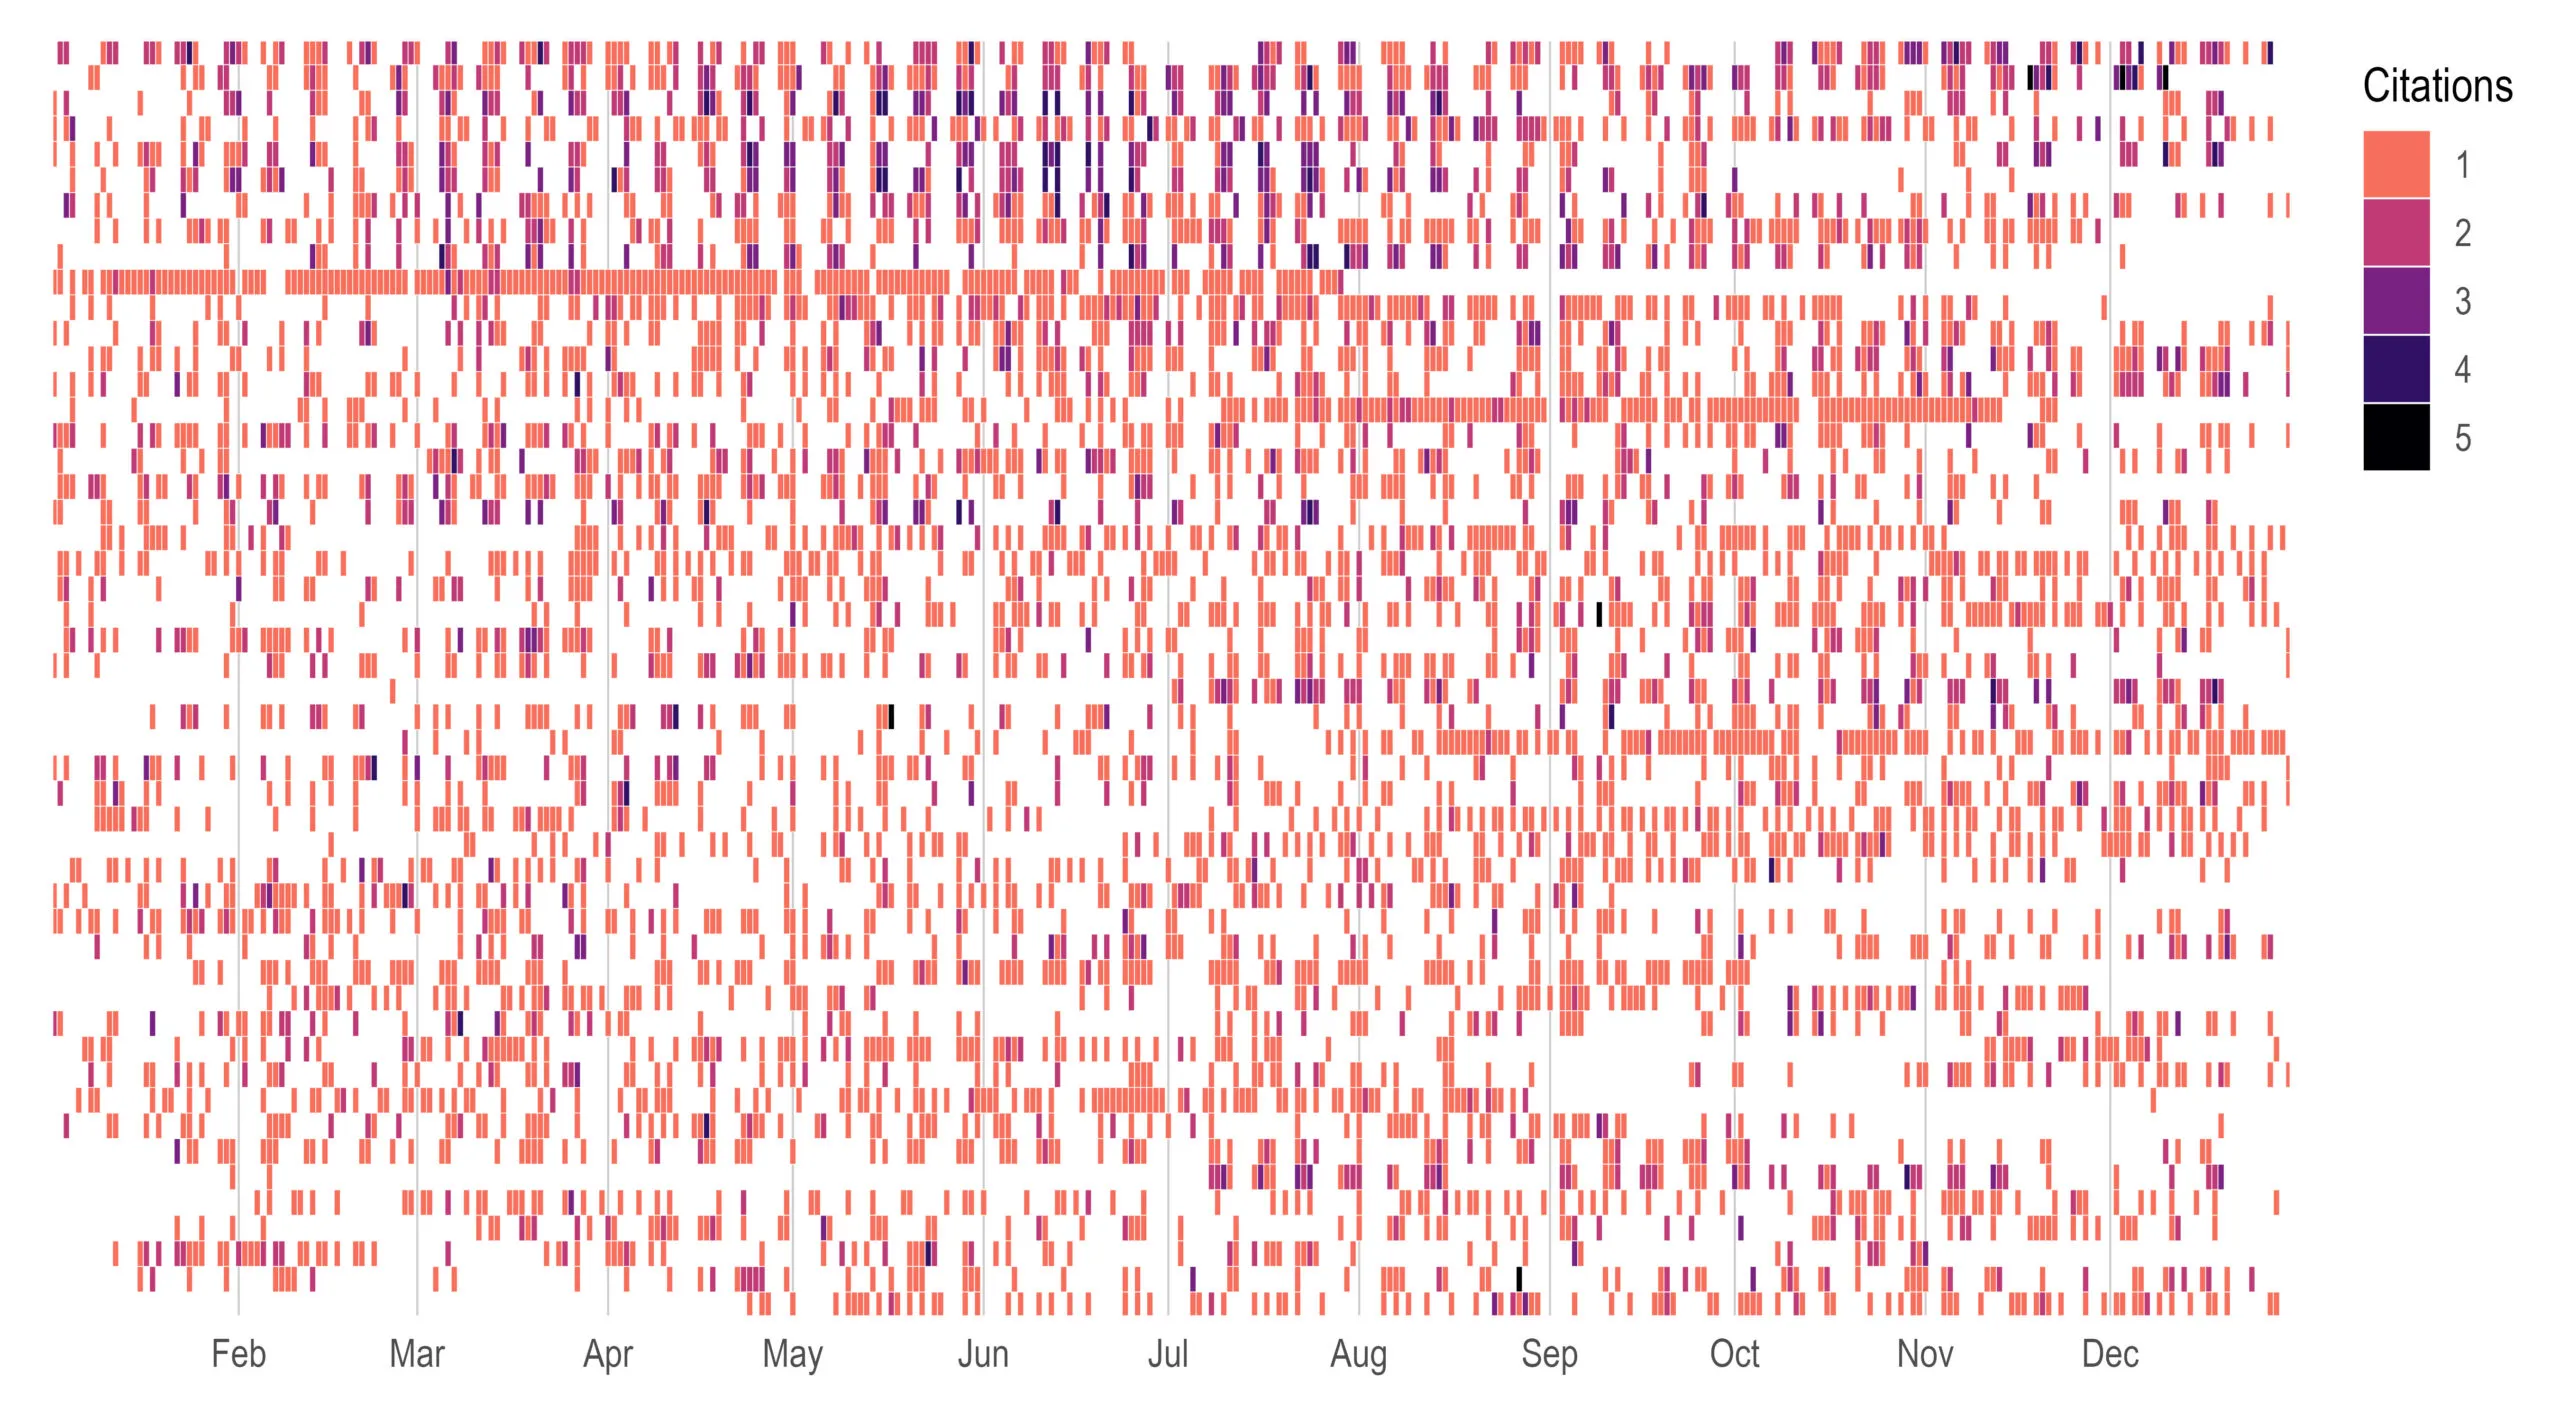
It also seems like for these nine violators, the citations stopped climbing after 2020. So perhaps we should just look at current violators? Below I plot the top 50 violators in 2024 (rows) where each column represents a day. On average, the top 50 violators had just three days between citations and one person managed the incredible feat of getting at least one citation every single day for 58 consecutive days.
Anyways, I don’t think there’s a take home here other than be careful when you’re crossing the street in San Francisco.
(Code is here.)