· 1 min read

Comparing daily (direct) COVID-19 deaths to other causes of death

It’s easy to get numb at this stage of the pandemic, but a friendly reminder that daily COVID-19 (direct) deaths have been consistently higher than 8 of the top 10 causes of death (in 2018) since April.

We’re on track for over 3,000 deaths per day by Christmas (!!) — things are not good.
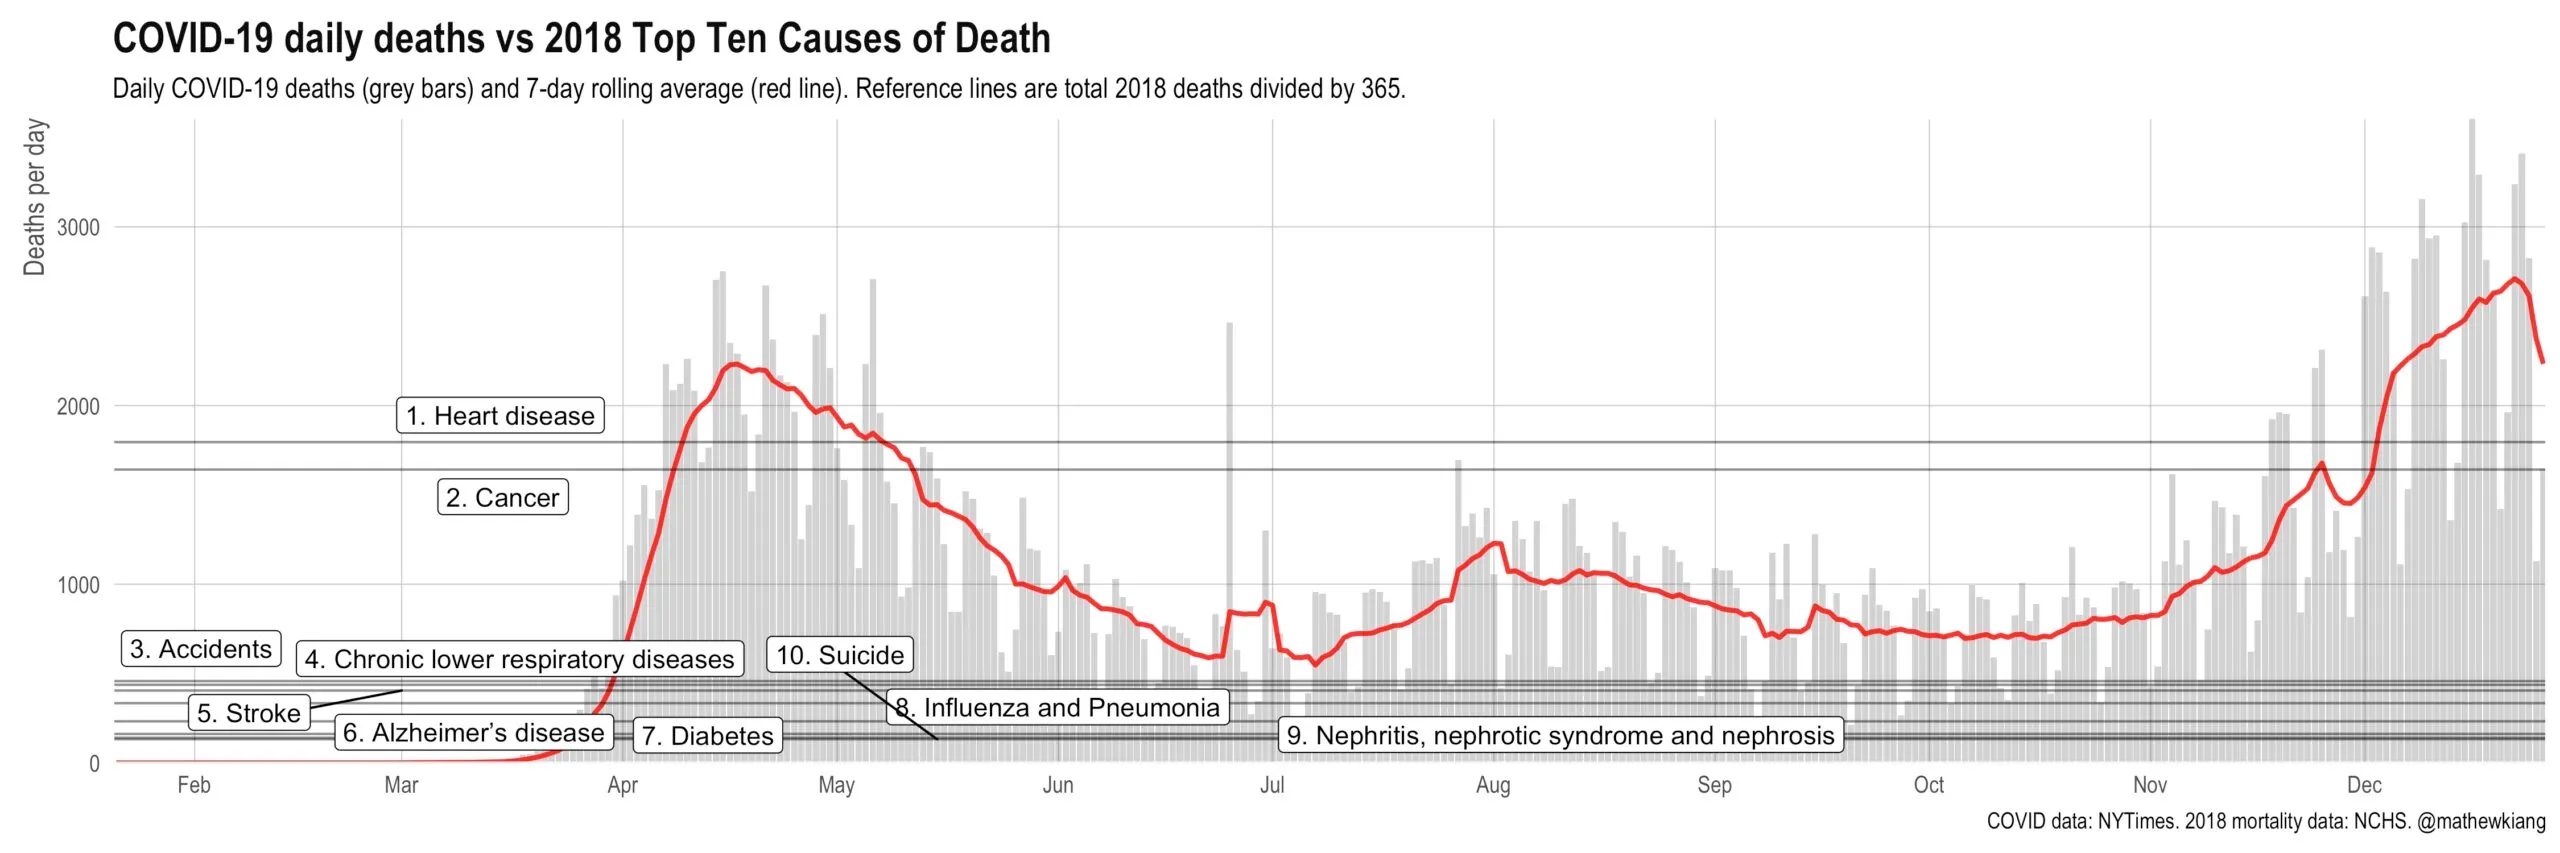
A chart titled COVID-19 daily deaths vs 2018 Top Ten Causes of Death, subtitled: daily COVID-19 deaths in grey bars and a 7-day rolling average in red, with reference lines at total 2018 deaths divided by 365. Deaths per day runs 0 to about 3,700 and the x-axis covers February to late December 2020. Ten labelled horizontal reference lines sit at each cause's daily average — 1. Heart disease at about 1,800 and 2. Cancer at about 1,650 near the middle, with 3. Accidents, 4. Chronic lower respiratory diseases, 5. Stroke, 6. Alzheimer's disease, 7. Diabetes, 8. Influenza and Pneumonia, 9. Nephritis, nephrotic syndrome and nephrosis and 10. Suicide bunched below 500. The red line rises from near zero in March to about 2,200 in April, above both heart disease and cancer, falls to about 550 in June, rises again to 1,250 in August, and climbs from November to about 2,700 by late December — the highest point on the chart. Sources are the NYTimes for COVID data and NCHS for 2018 mortality.

Code here. (This figure was last updated on 12/27/2020 — at least some of the decline in the last few days is simply due to holiday reporting delays.)