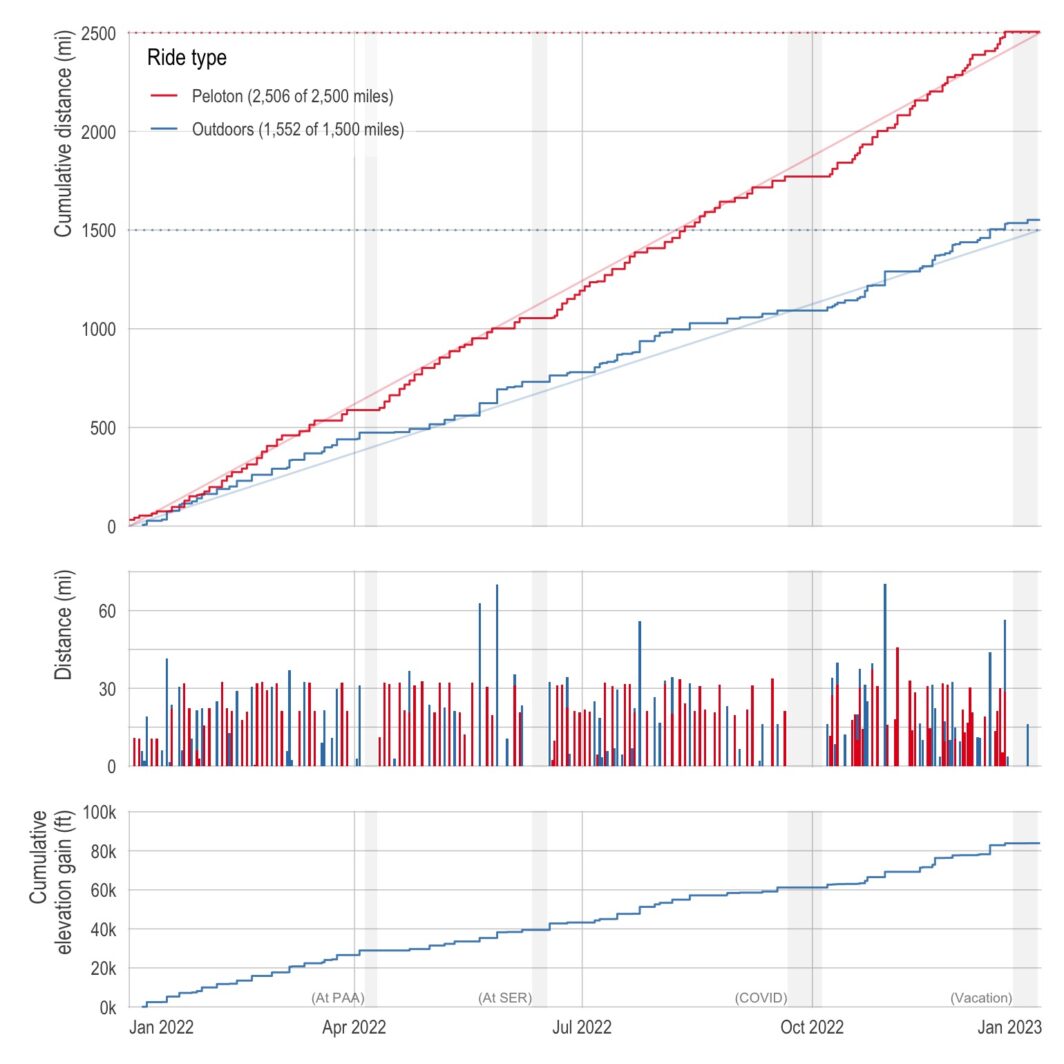
Below is a plot of my cumulative distance (and elevation) over the course of the year. I just barely got the distance resolutions with 1,551.7 miles outdoors and 2,506.1 indoors. I missed the elevation resolution by about 16,000 feet (ending at 83,899 feet).
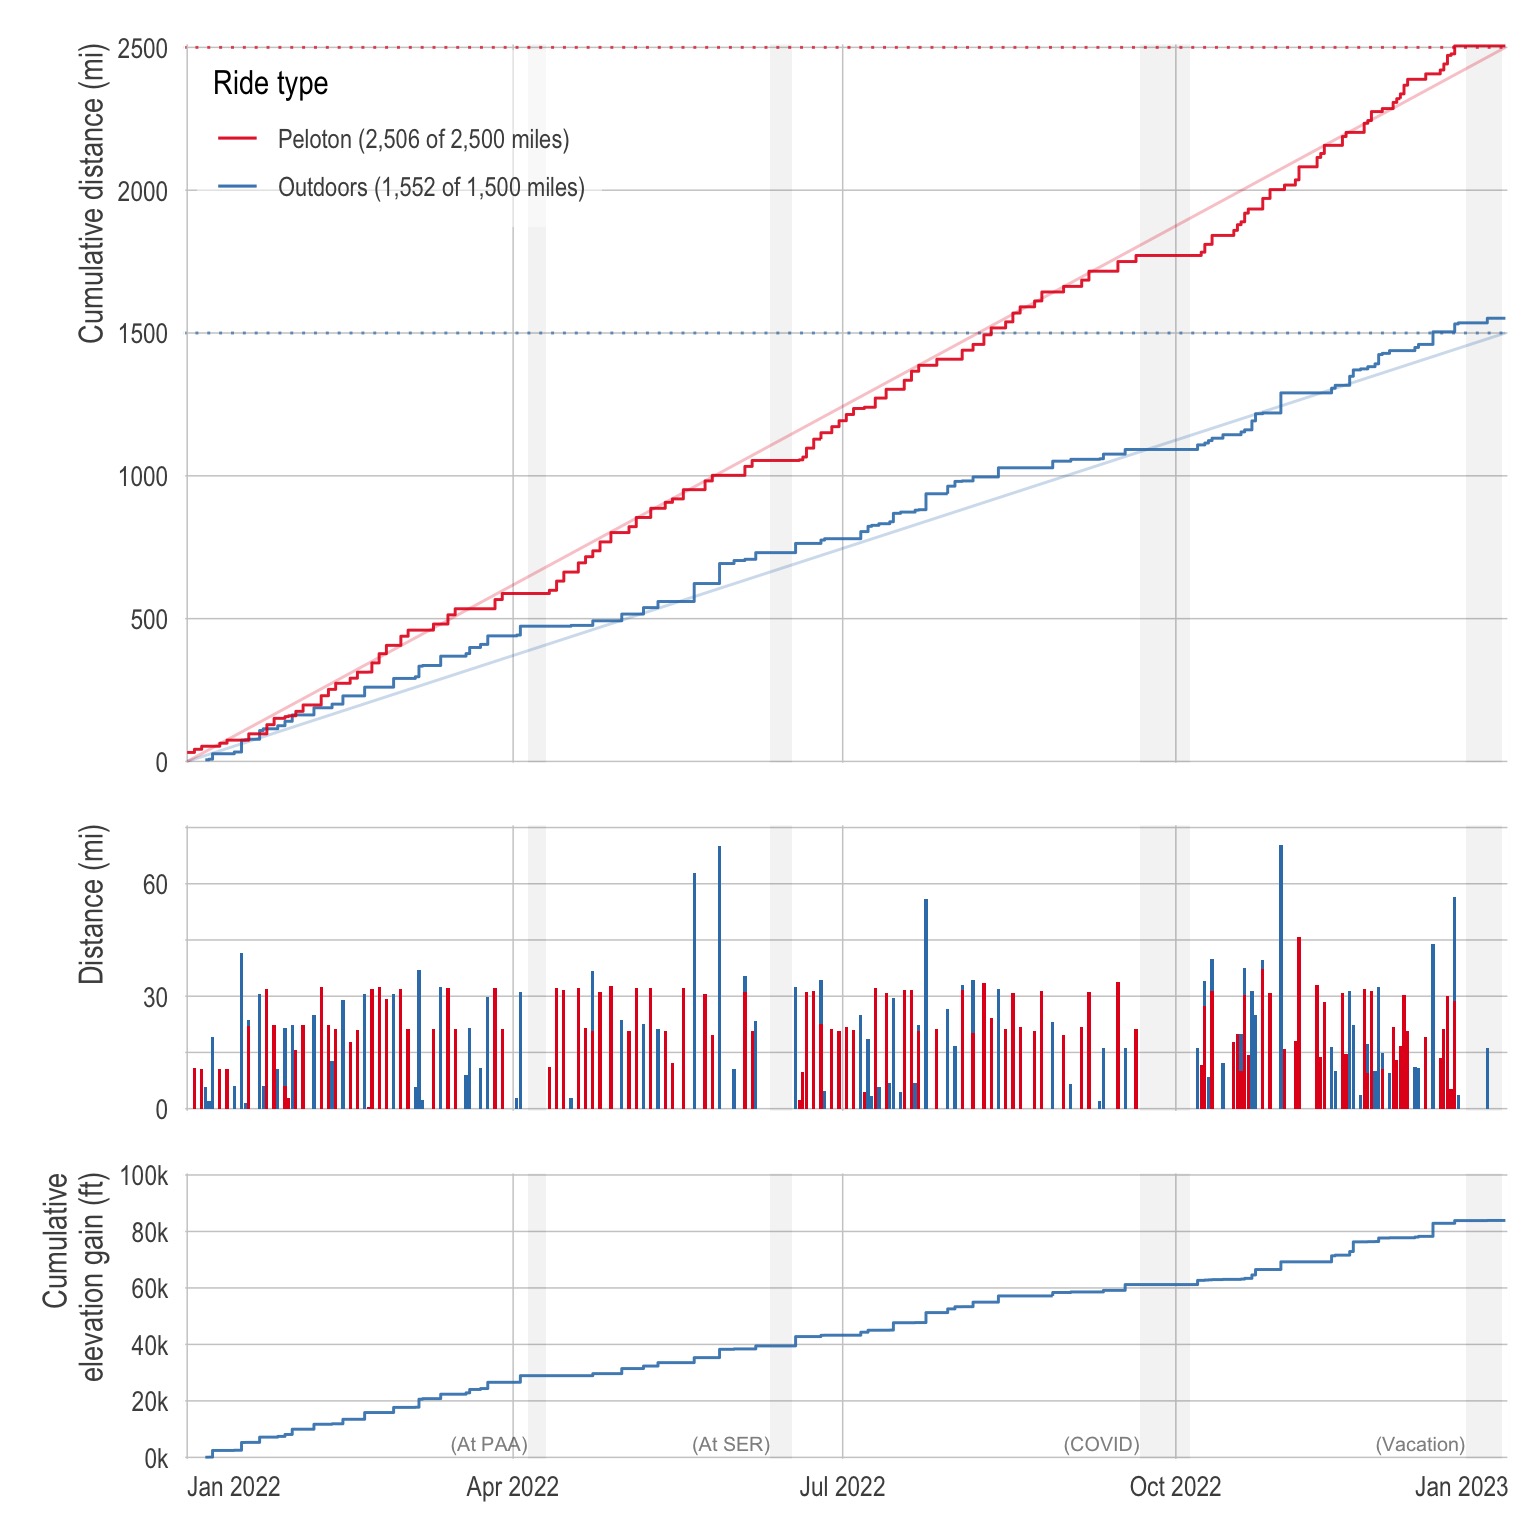
Red represents Peloton rides while blue represents outdoor rides. The vertical shaded areas represent periods where I was away from home or unable to bike. In September, I got COVID, which kept me off the bike for weeks and way behind schedule on my miles. Even when I did manage to get back on the bike, I was unable to do particularly long or intense rides for a few more weeks. Brutal.
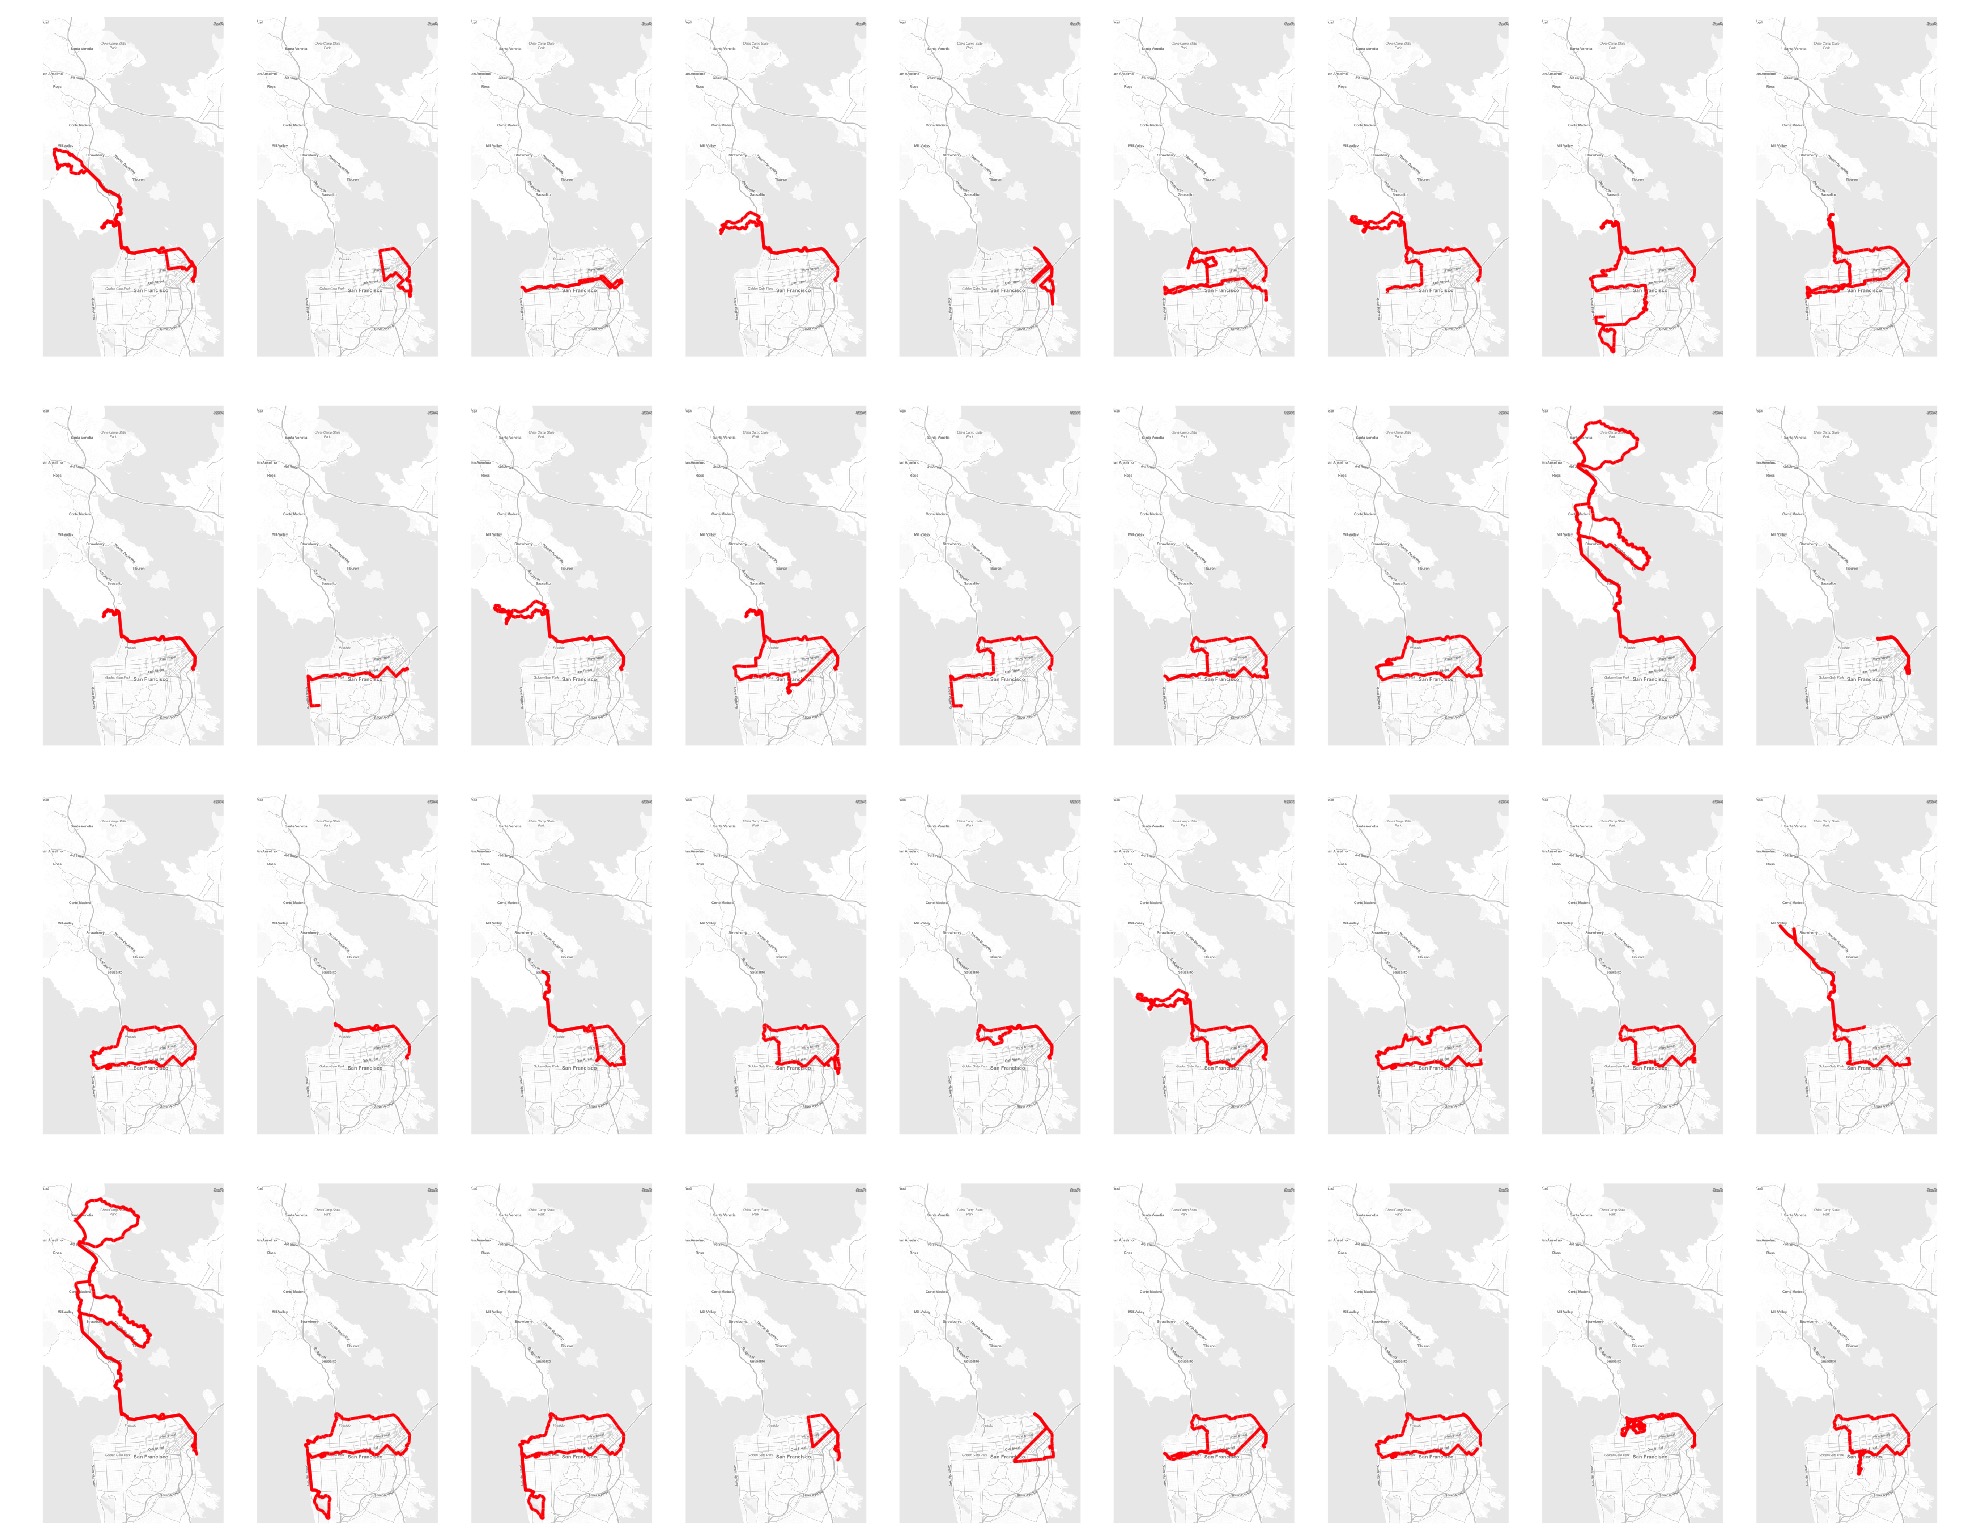
Anyways, as a San Diego native, I never really understood the hype around San Francisco — it just seemed crowded with dirty beaches. It’s still crowded with dirty beaches but biking has given me a much greater appreciation for the city. It’s surreal to ride between skyscrapers, then along the Bay overlooking Alcatraz, then through the the giant pine trees of the Presidio, over the Golden Gate Bridge, and along the cliffs overlooking the Pacific — all in a single ride. Below, is a sample of 36 rides around San Francisco.
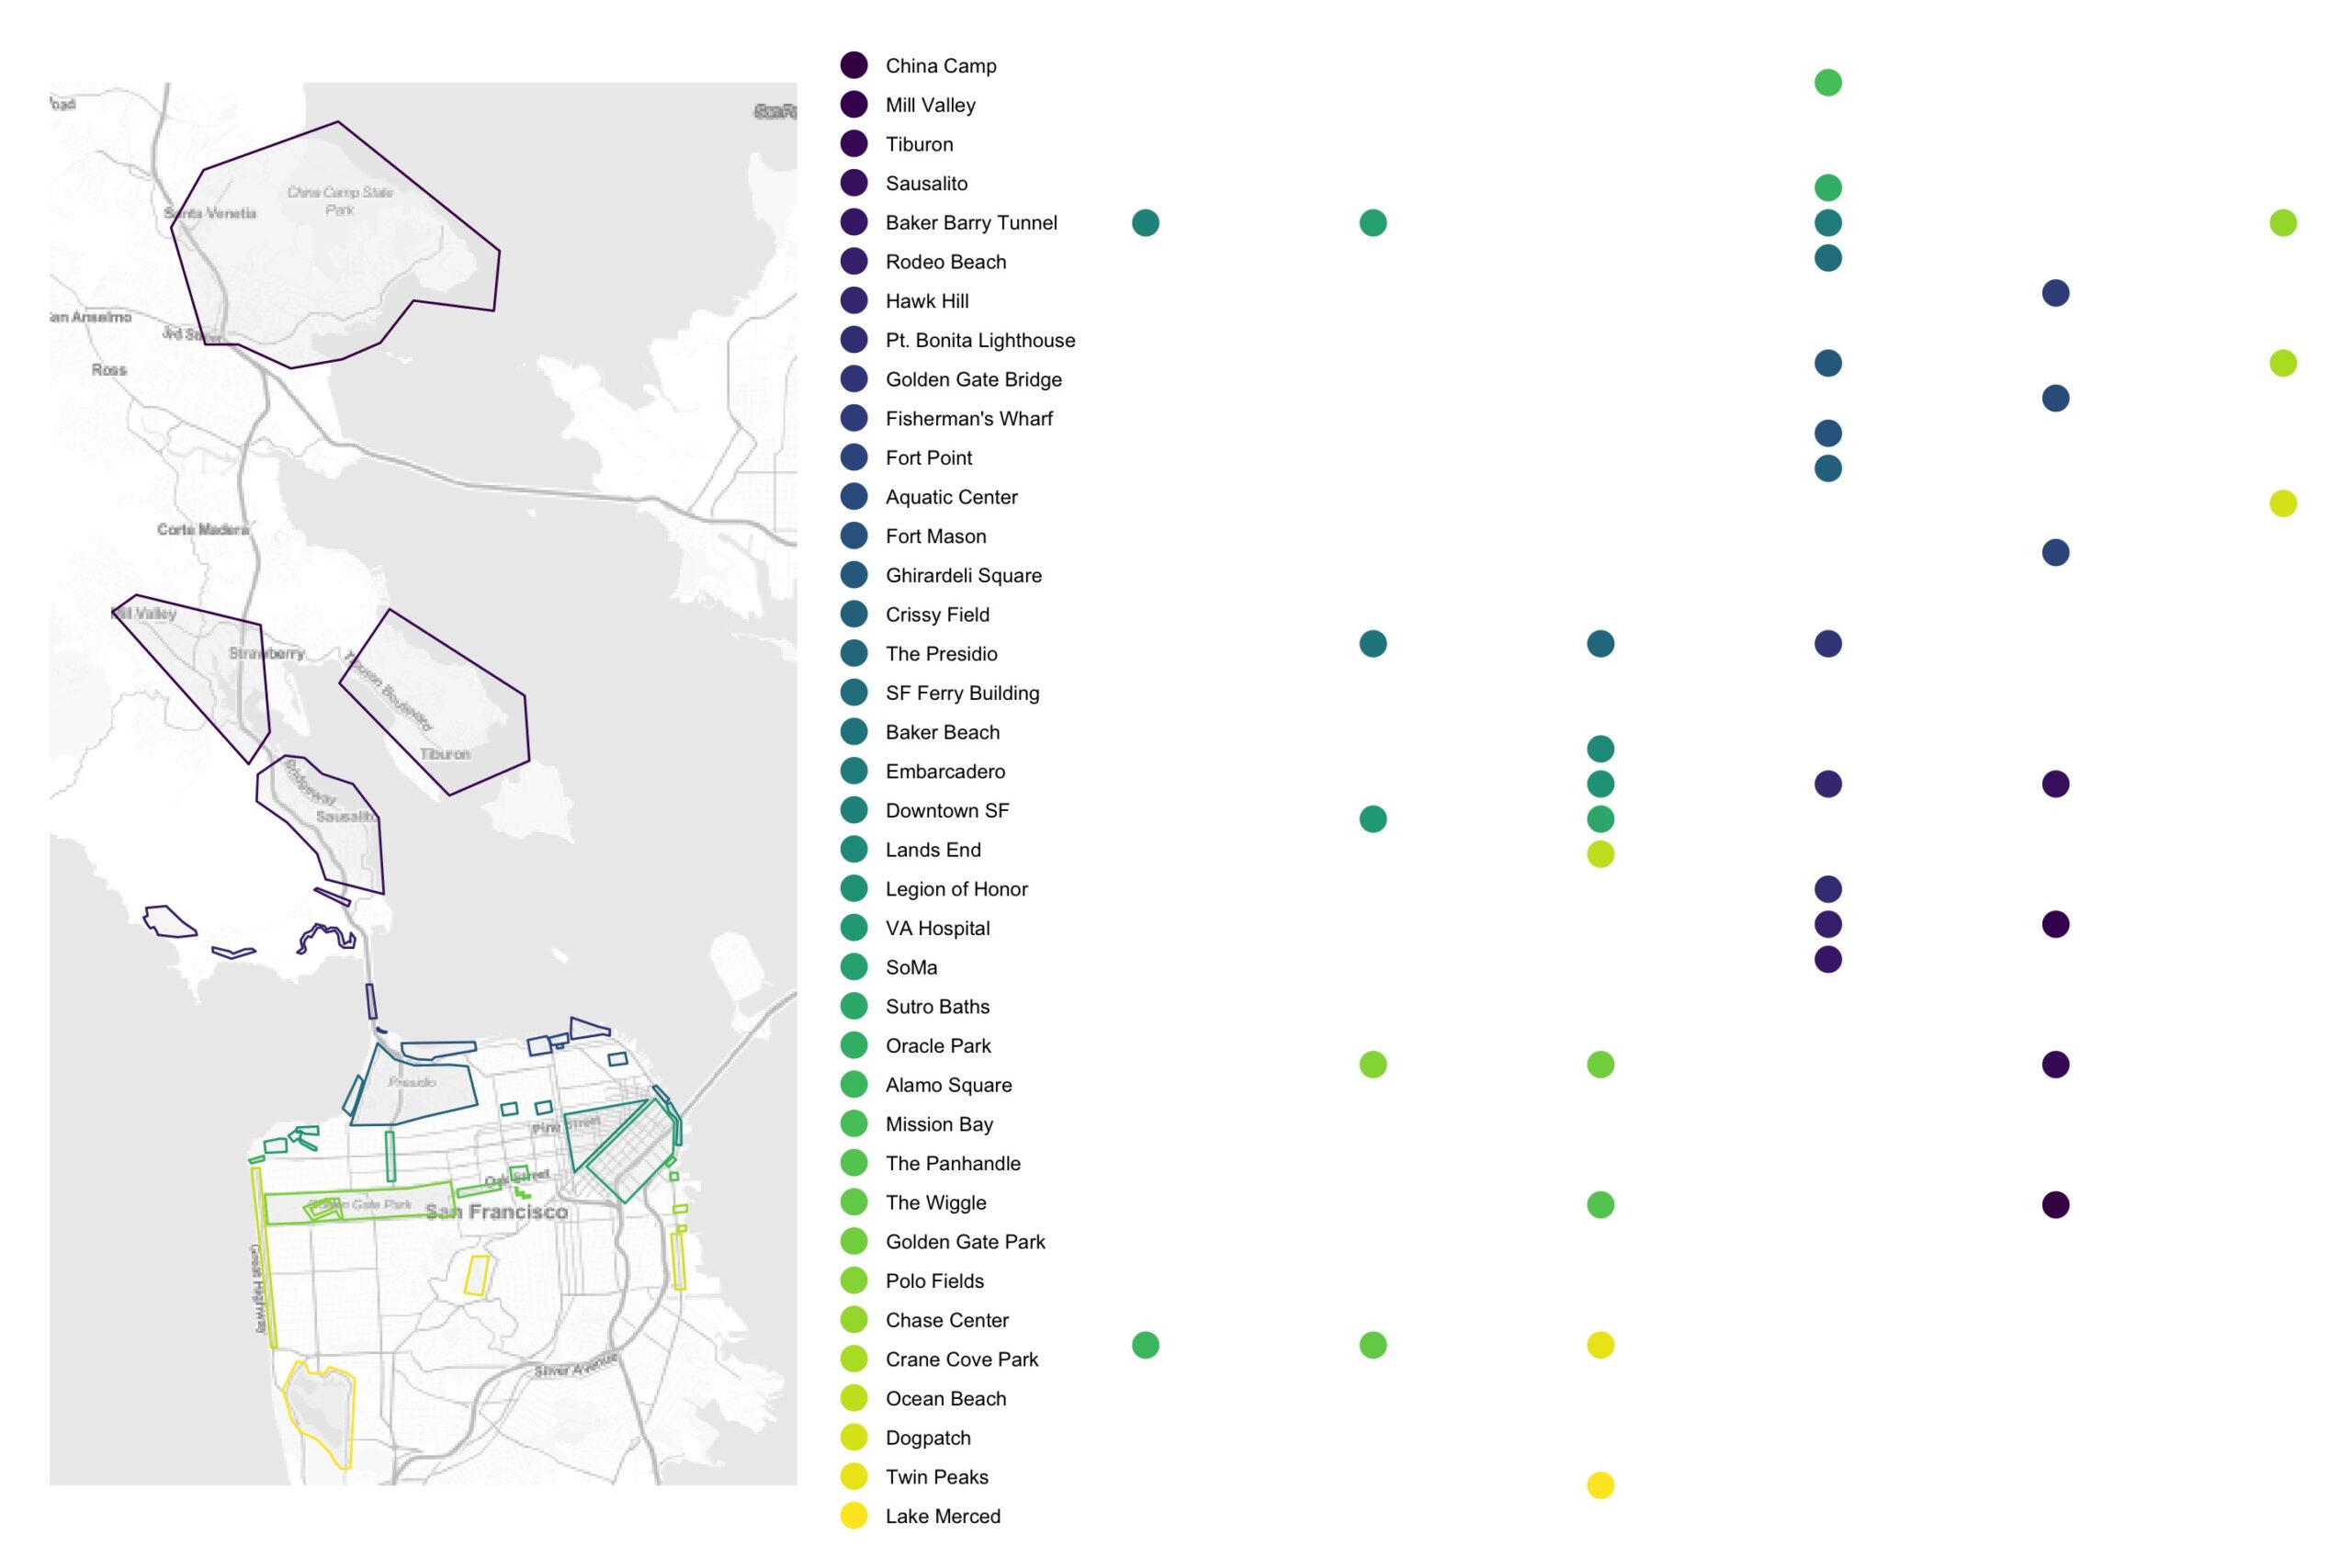
A really nice aspect of riding in San Francisco is that you don’t really need a plan. There are enough routes that are connected to things worth checking out that you can just wing it as you ride and change your route depending on how your legs feel that day. This made me curious though. Which areas provide the most options? What areas do I tend to always string together? How many more miles (or feet of climbing) does going down a different branch add? To get at some of these questions, I took different parts of San Francisco and outline them on a map (left) as well as arbitrarily relocate them on a network representation (right). Note that the color gradient is roughly by latitude, but this doesn’t translate to the network representation.
Below, we can then take a subset of rides that start and end in San Francisco (left) and plot them as a network (right) where the nodes still represent geographic areas, the size and transparency of the node represents the number of visits (in-degree), and the edges represent my biking transitions from one area to another (darker means more of those transitions). 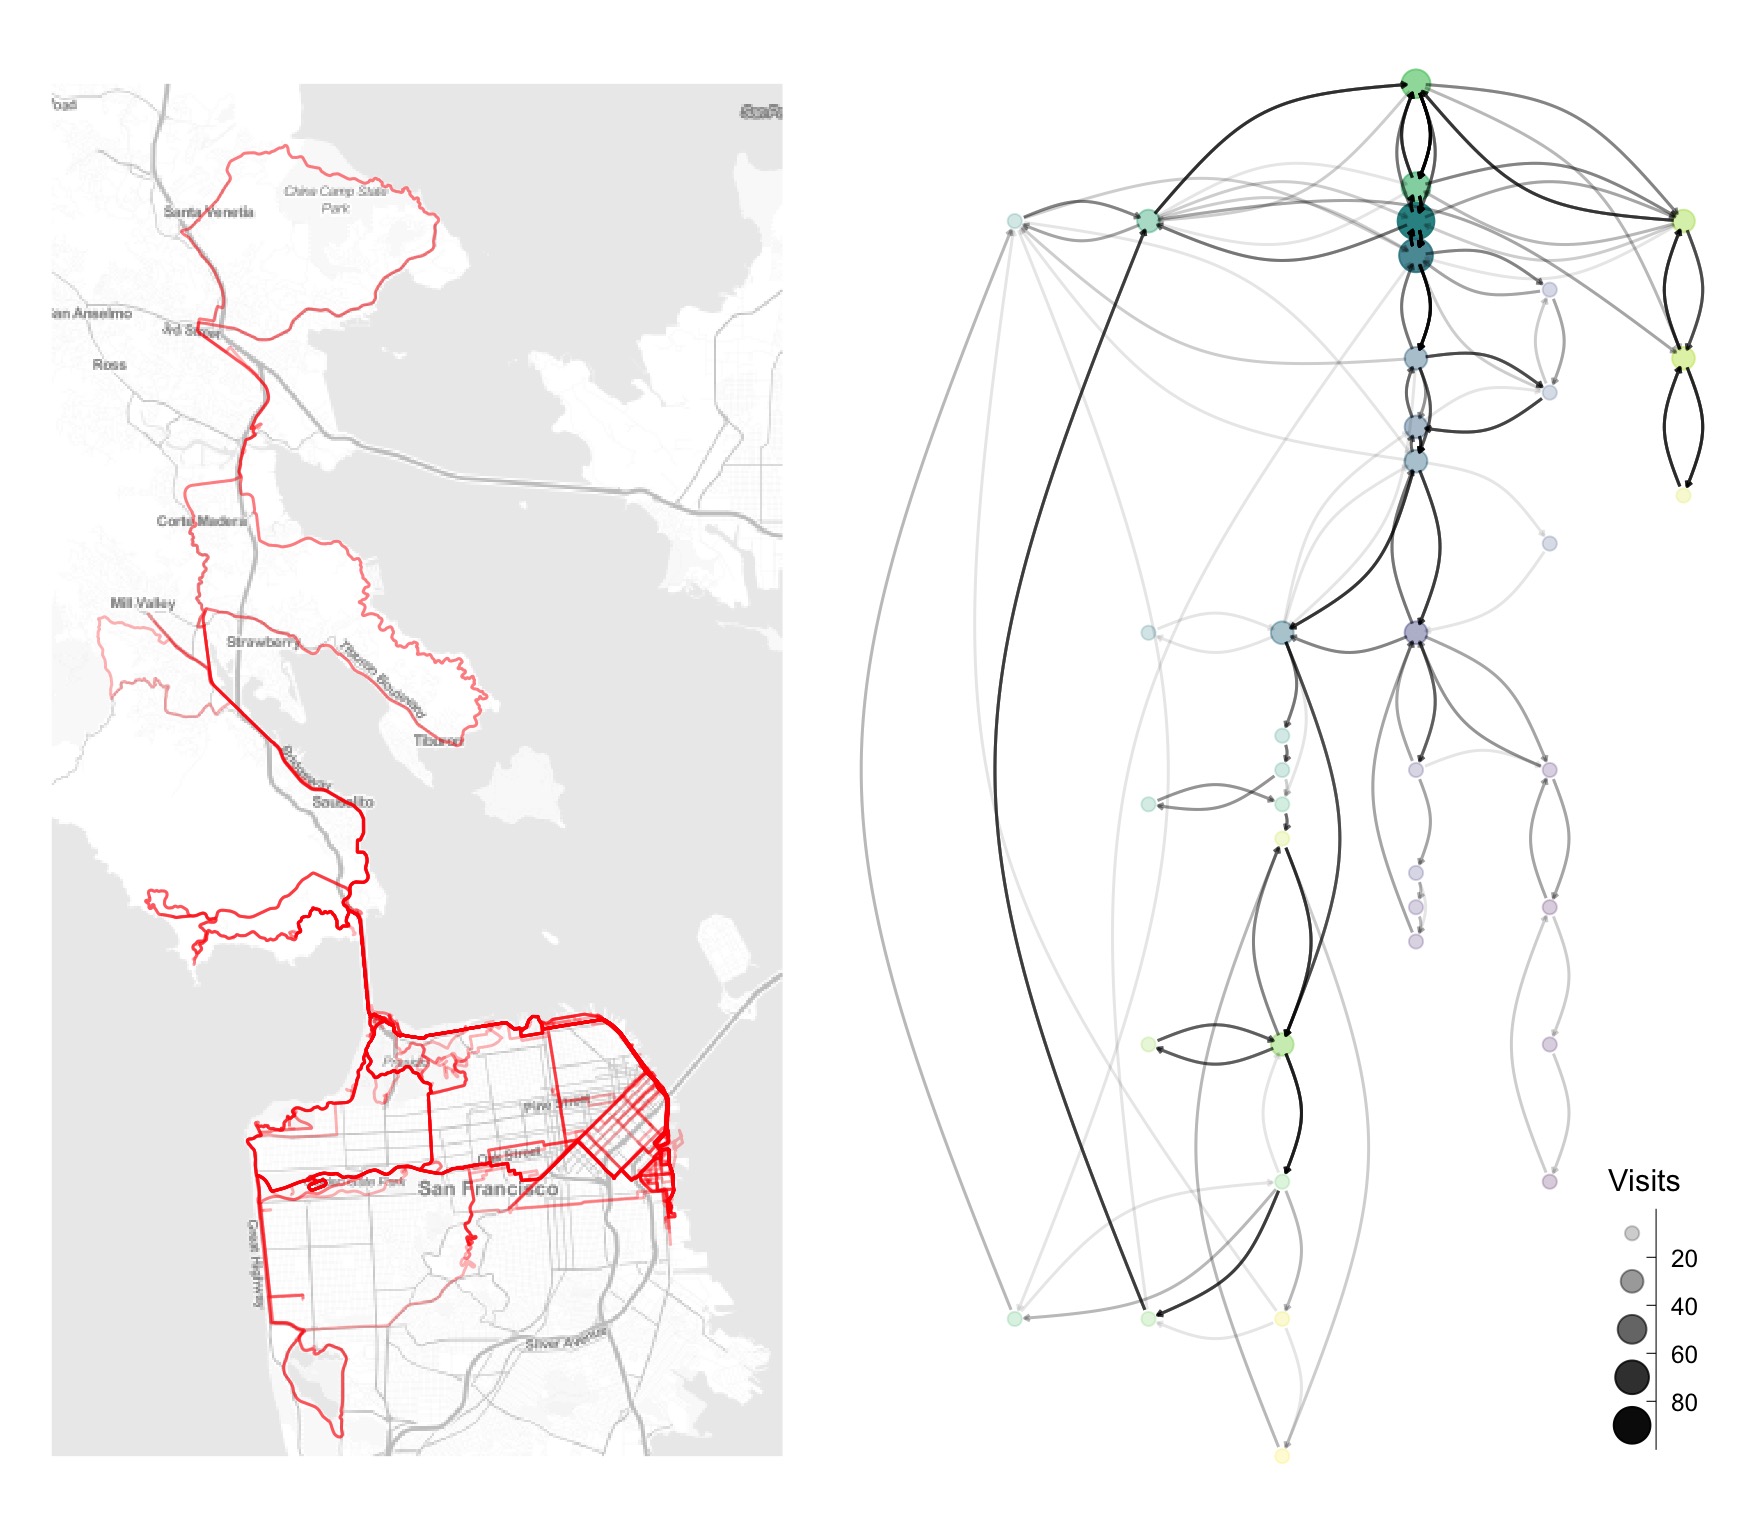
Here is a popular route called a Butterlap. It’s beautiful and my go-to route when showing out-of-towners around. It lets them see the main San Francisco spots (the Bay Bridge, the Ferry Building, Fisherman’s Wharf, Crissy Field, Alcatraz, Golden Gate Bridge, the Presidio, Land’s End, the Legion of Honor, Ocean Beach, Golden Gate Park, and downtown SF) and is reasonably flat.
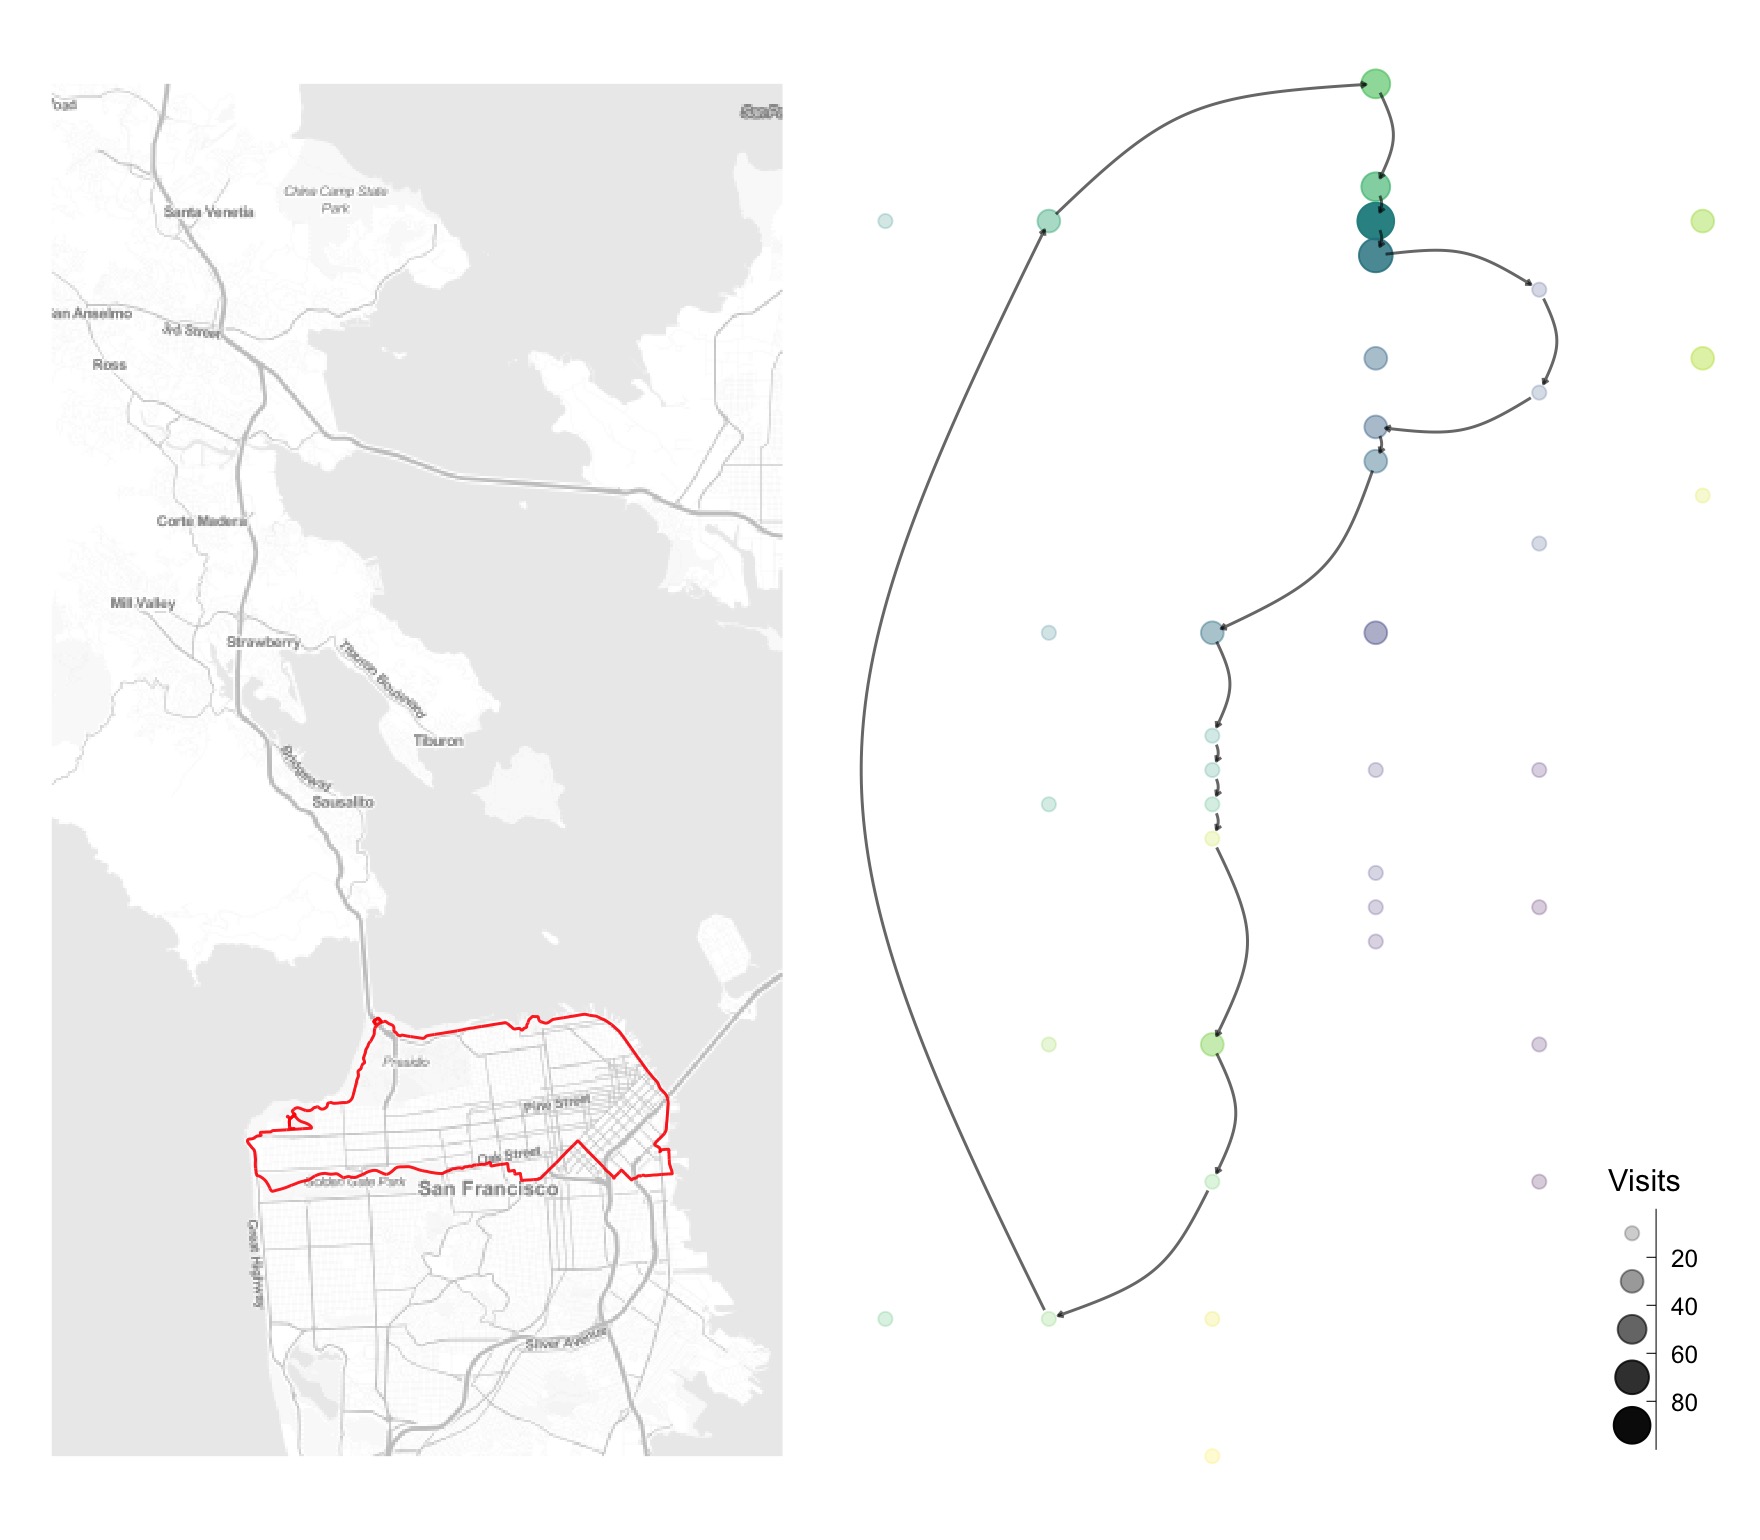
If, in the middle of the ride, you decide you have another 10 miles in you, you can quickly convert this to (what I’ve called) the Butter Lake, which involves a loop around Lake Merced to the south of the city.
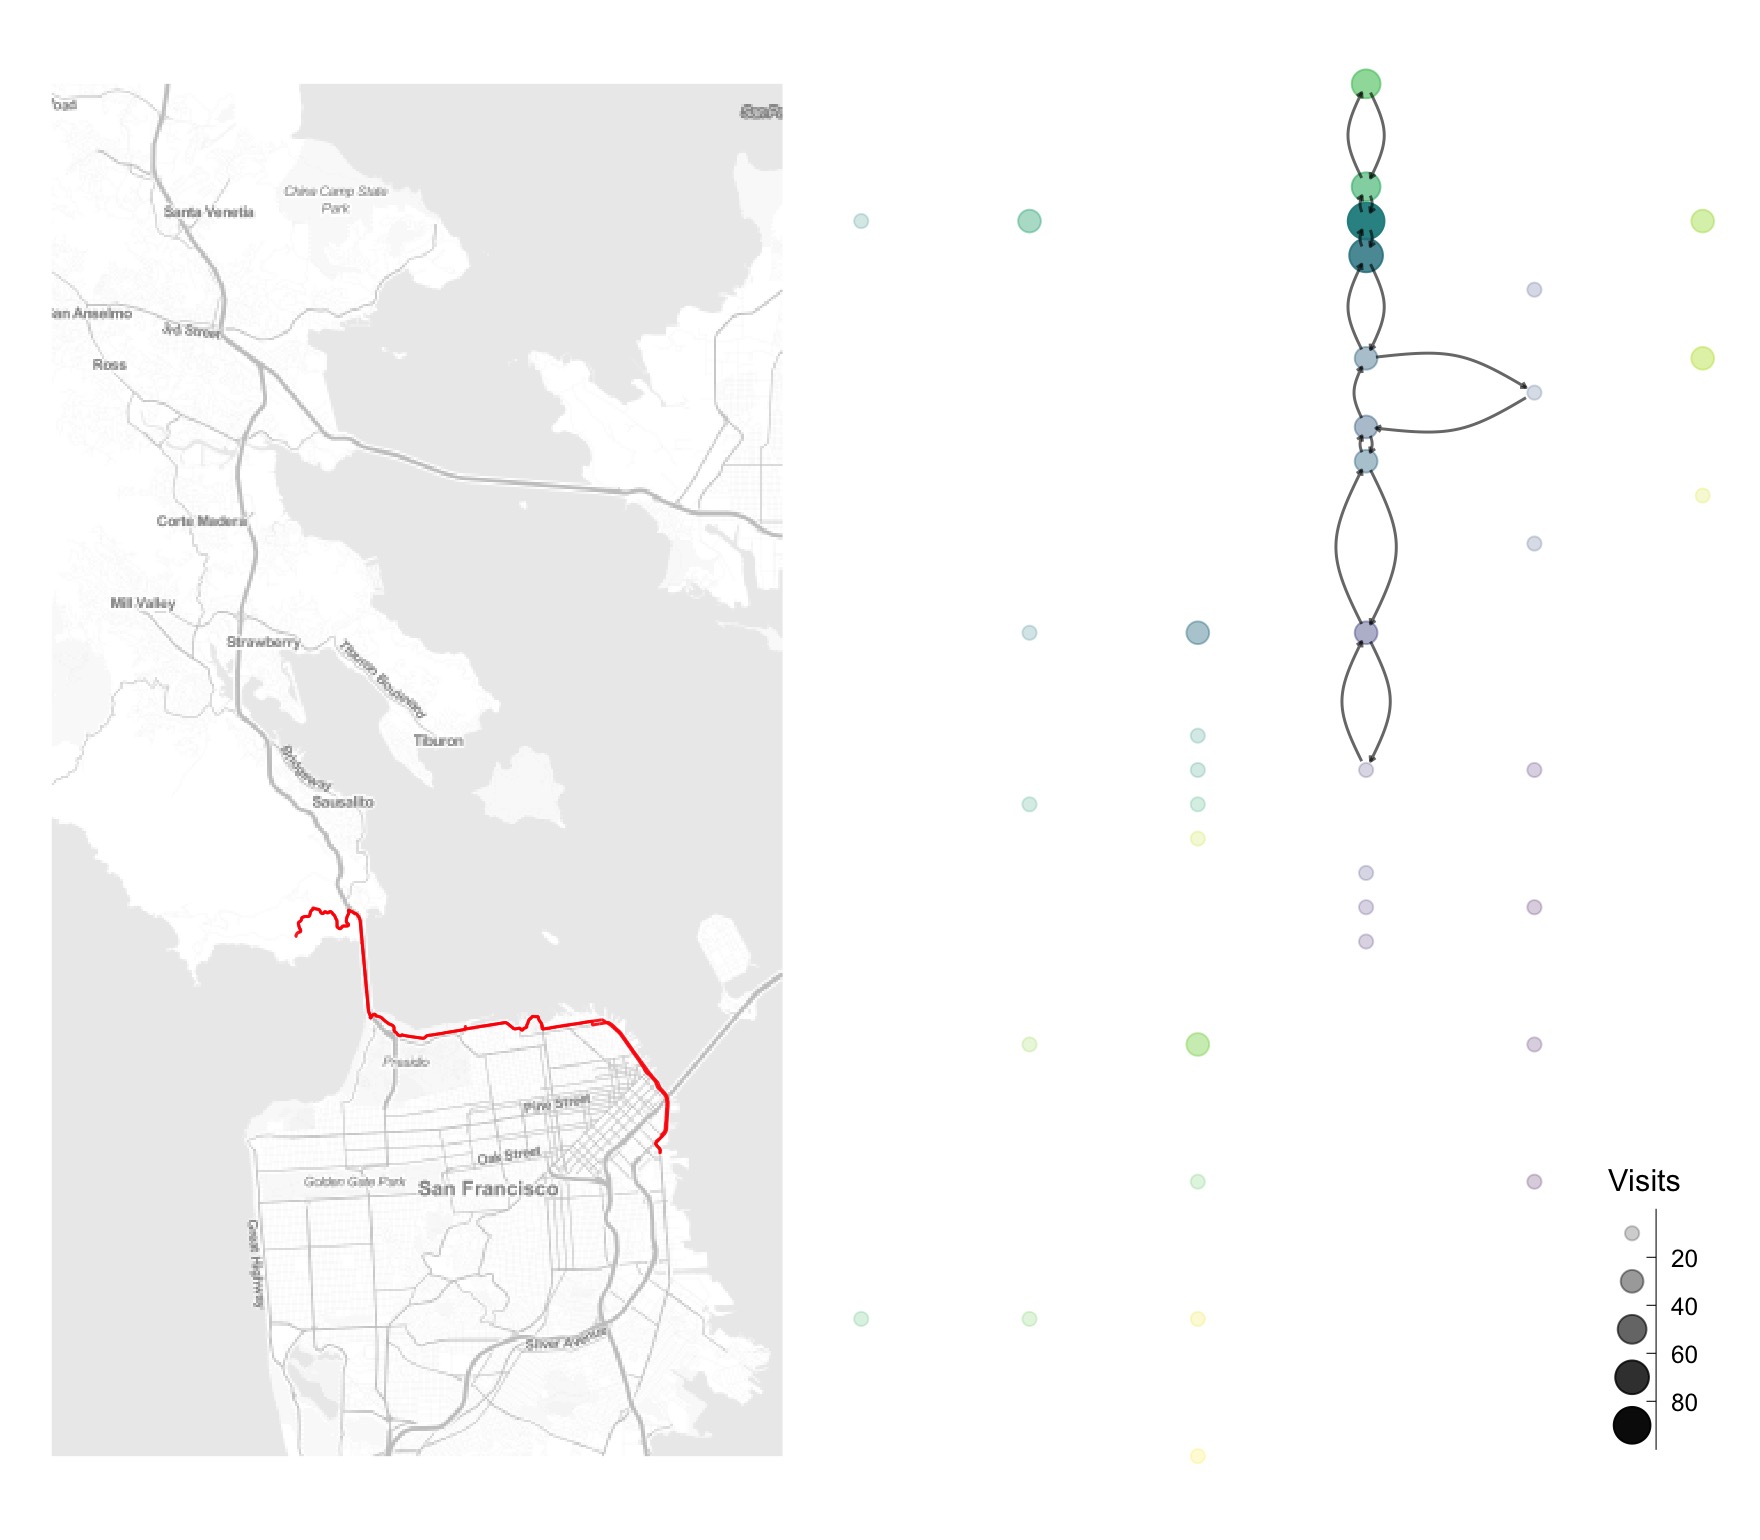
My favorite route in San Francisco involves crossing the Golden Gate Bridge and going up Hawk Hill. Hawk Hill is *the* classic SF climb and if you go in the morning on weekdays, it’s not uncommon to see pros of team training. It’s a great climb with stunning views and a fun, fast descent. In our two representations, the route looks like this.
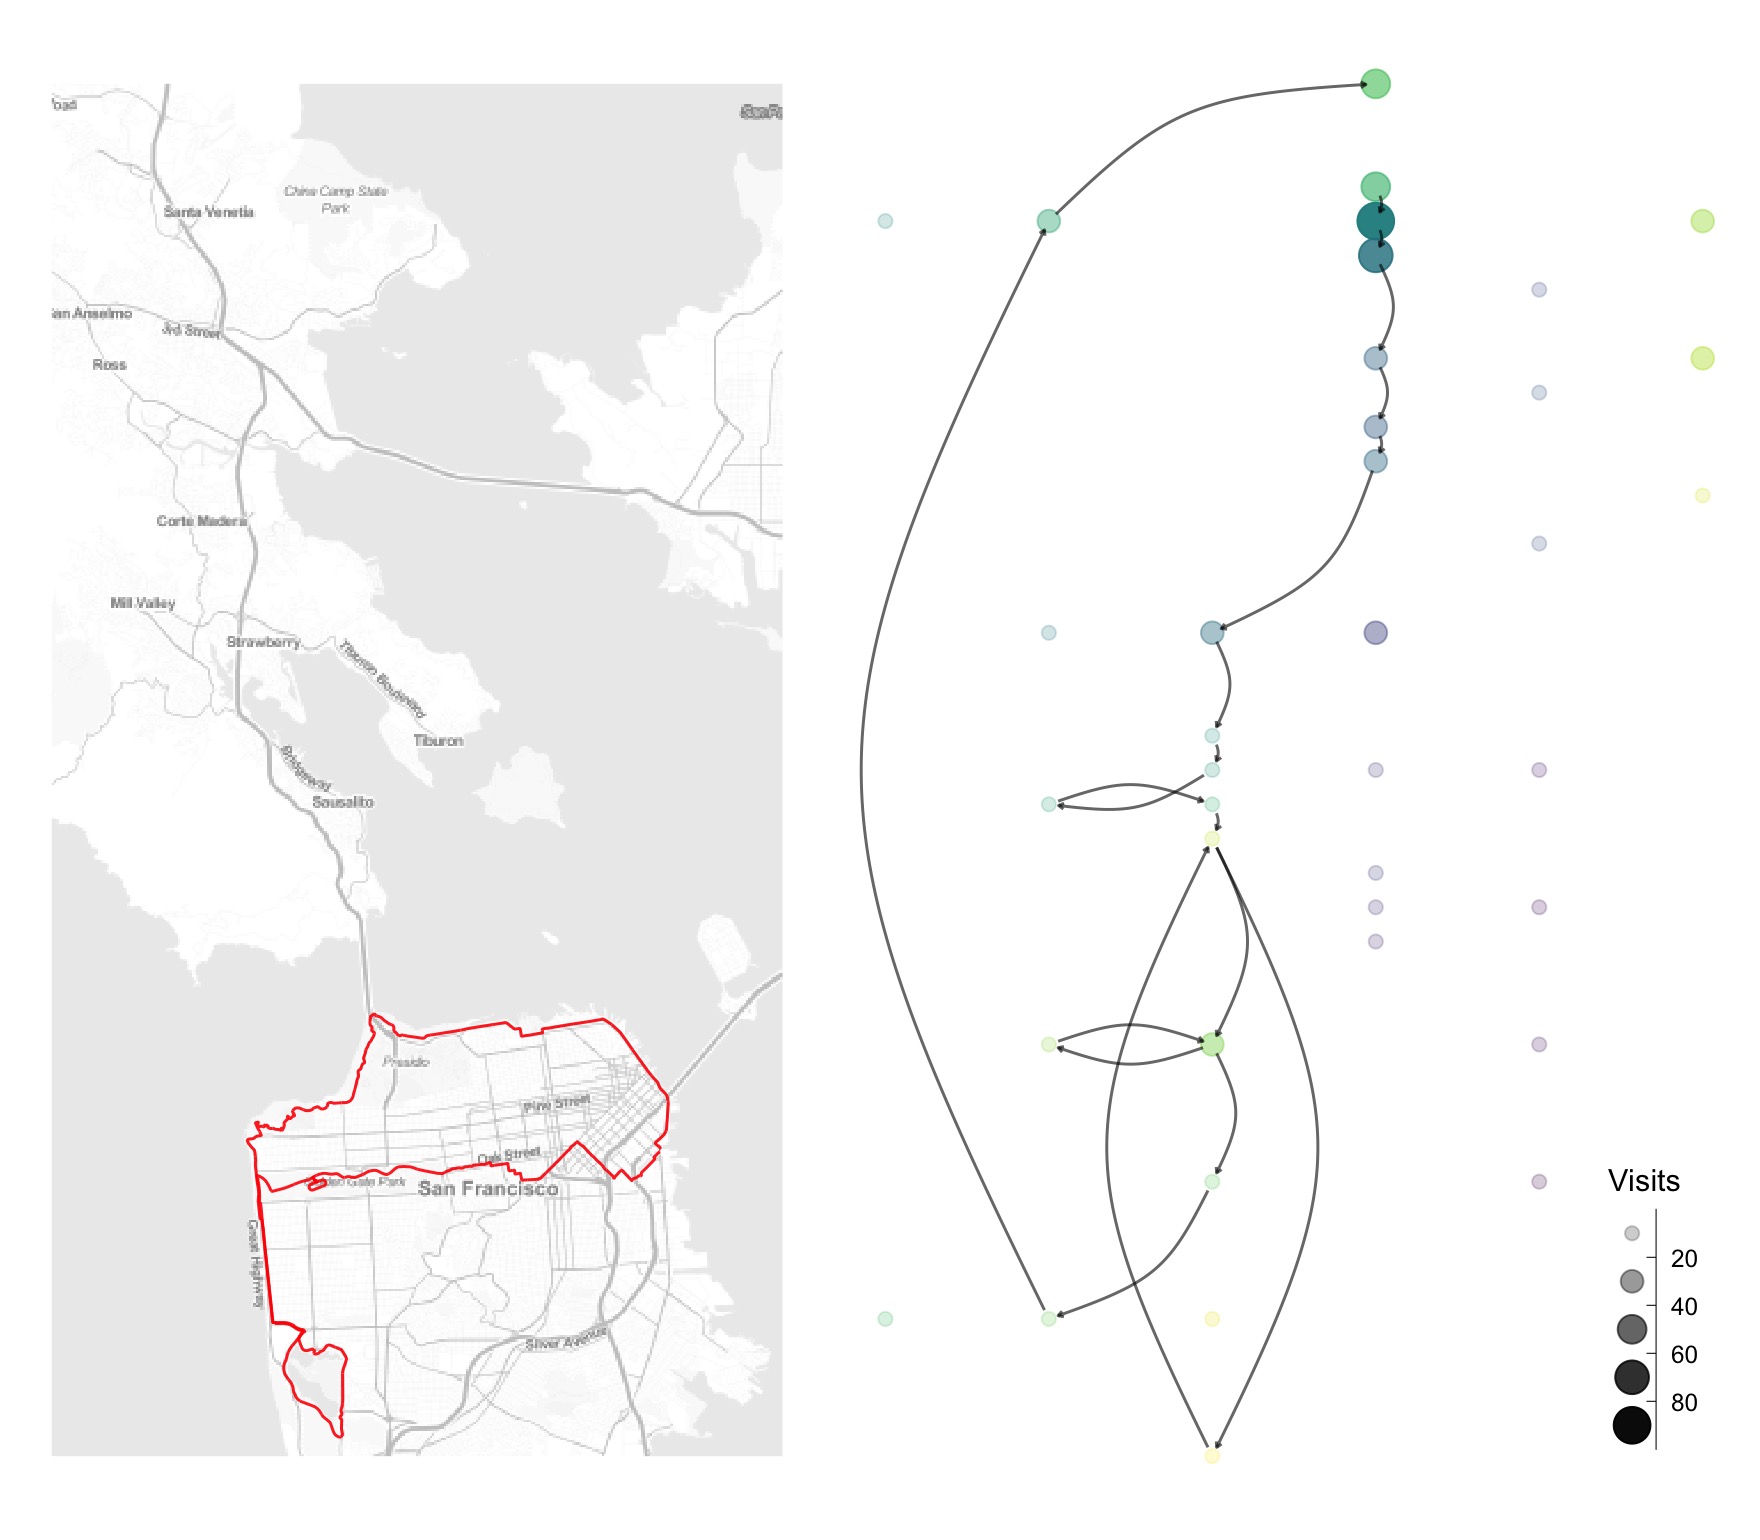
But there are many days when I get to the bottom of Hawk Hill and my legs decide they just don’t have any climbing in them. So instead, you can add 50 miles and do a Paradise + China Camp loop.
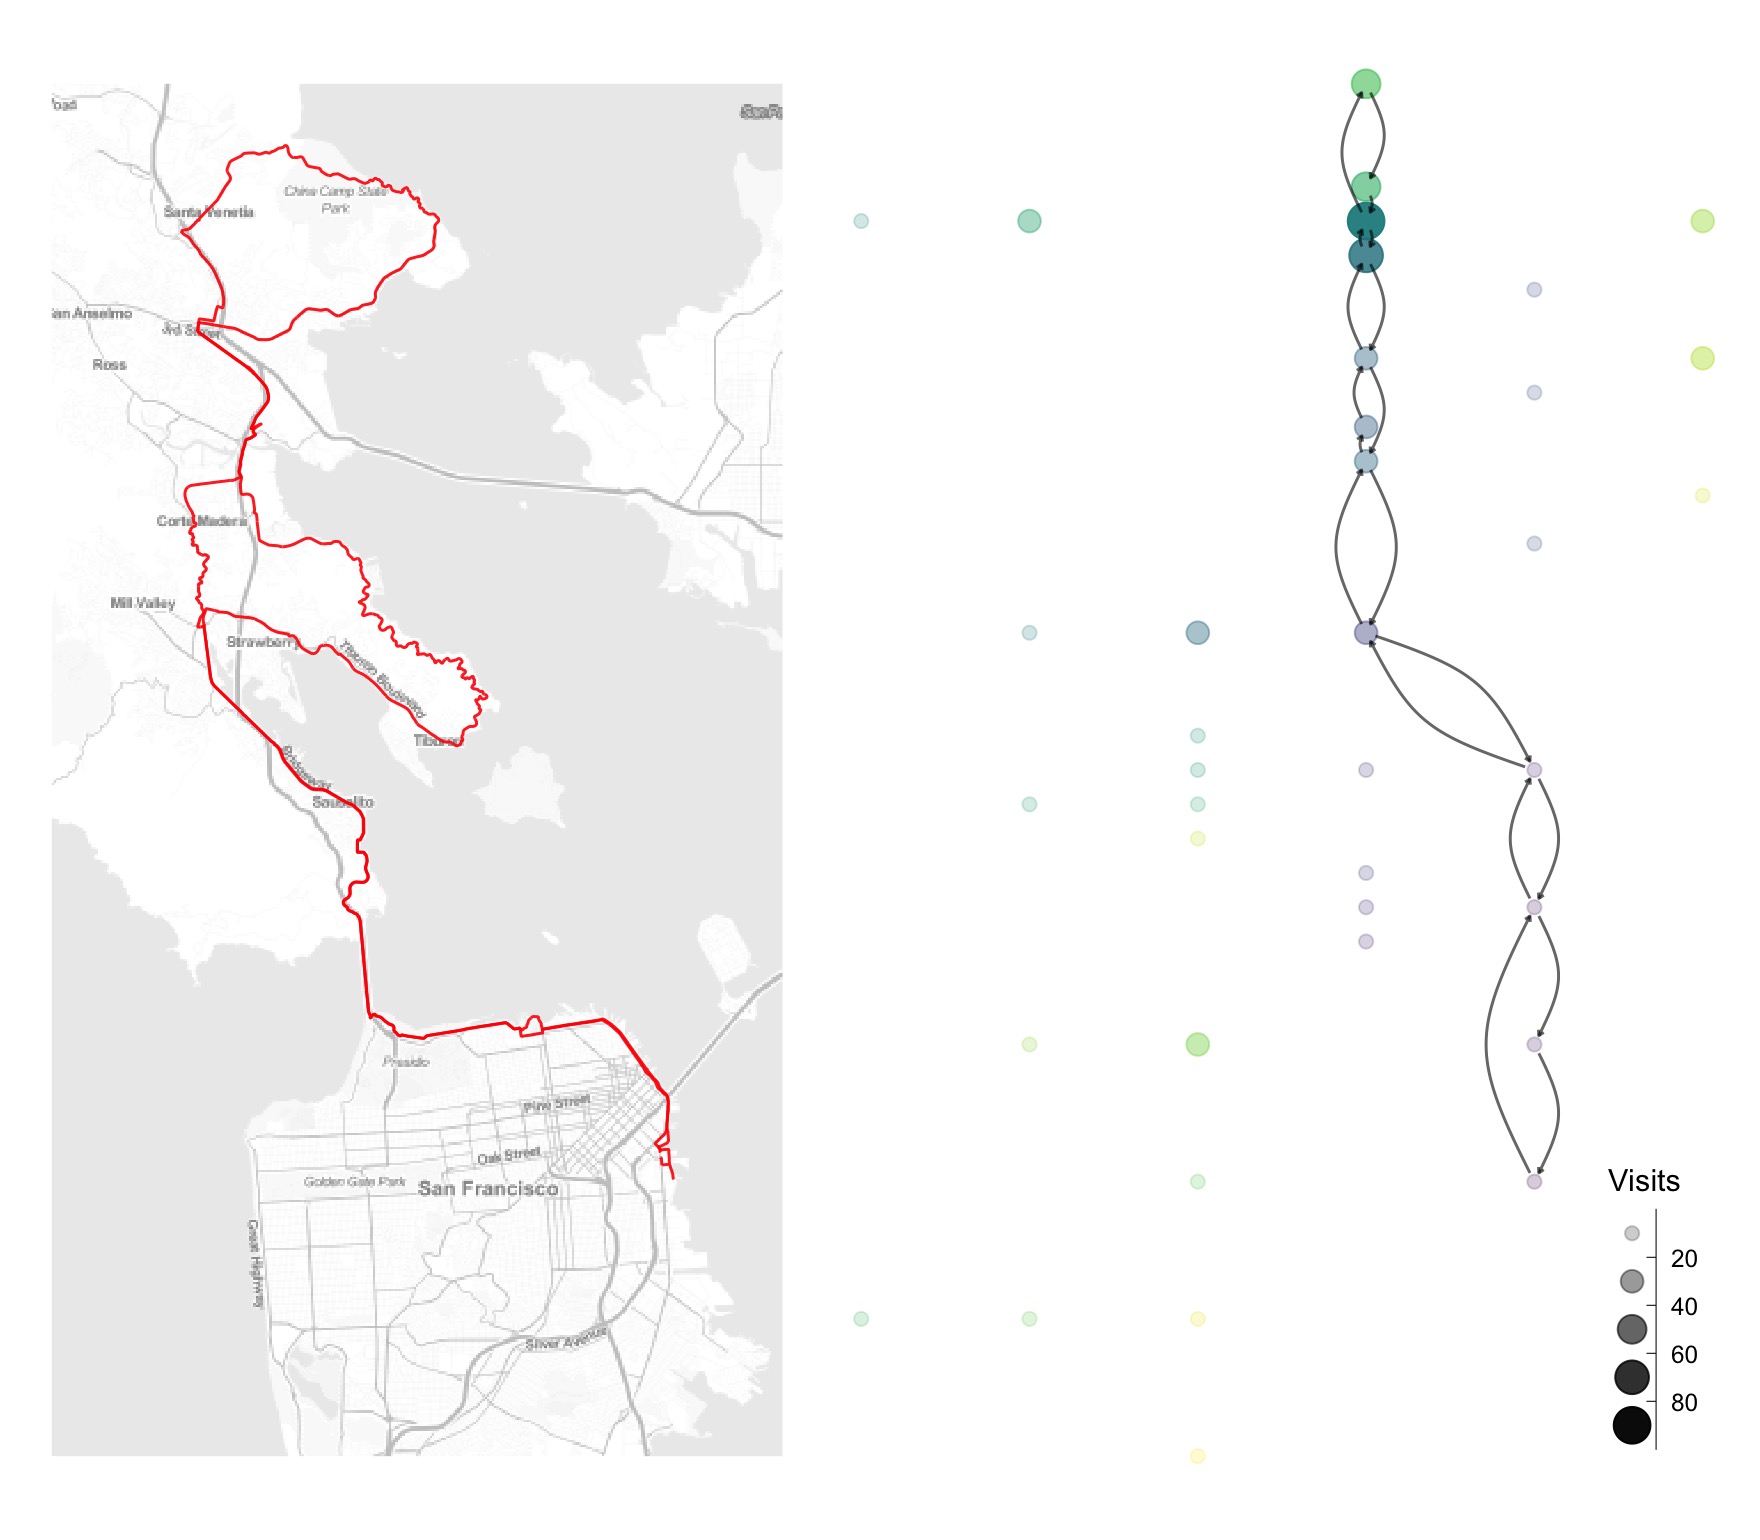
Networks are a useful way of identifying and visualizing these types of decision points. Some more network-based bike metrics to come once I gather more data — any excuse for a few more rides.