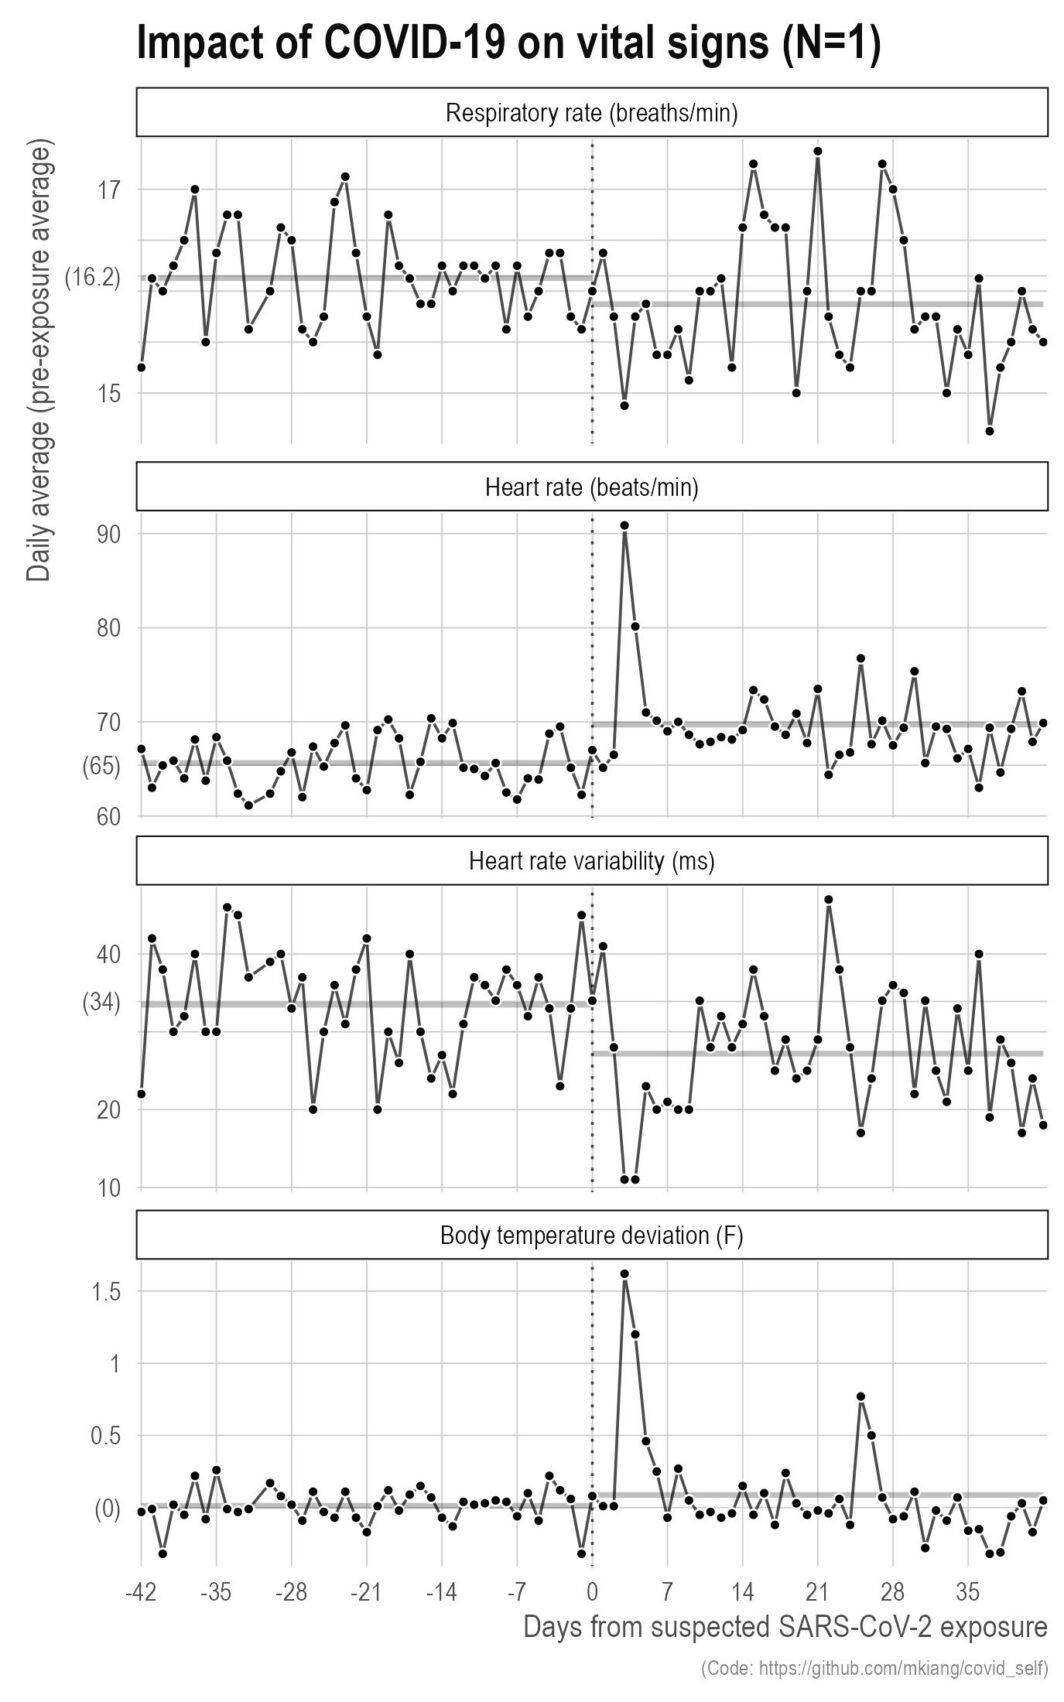
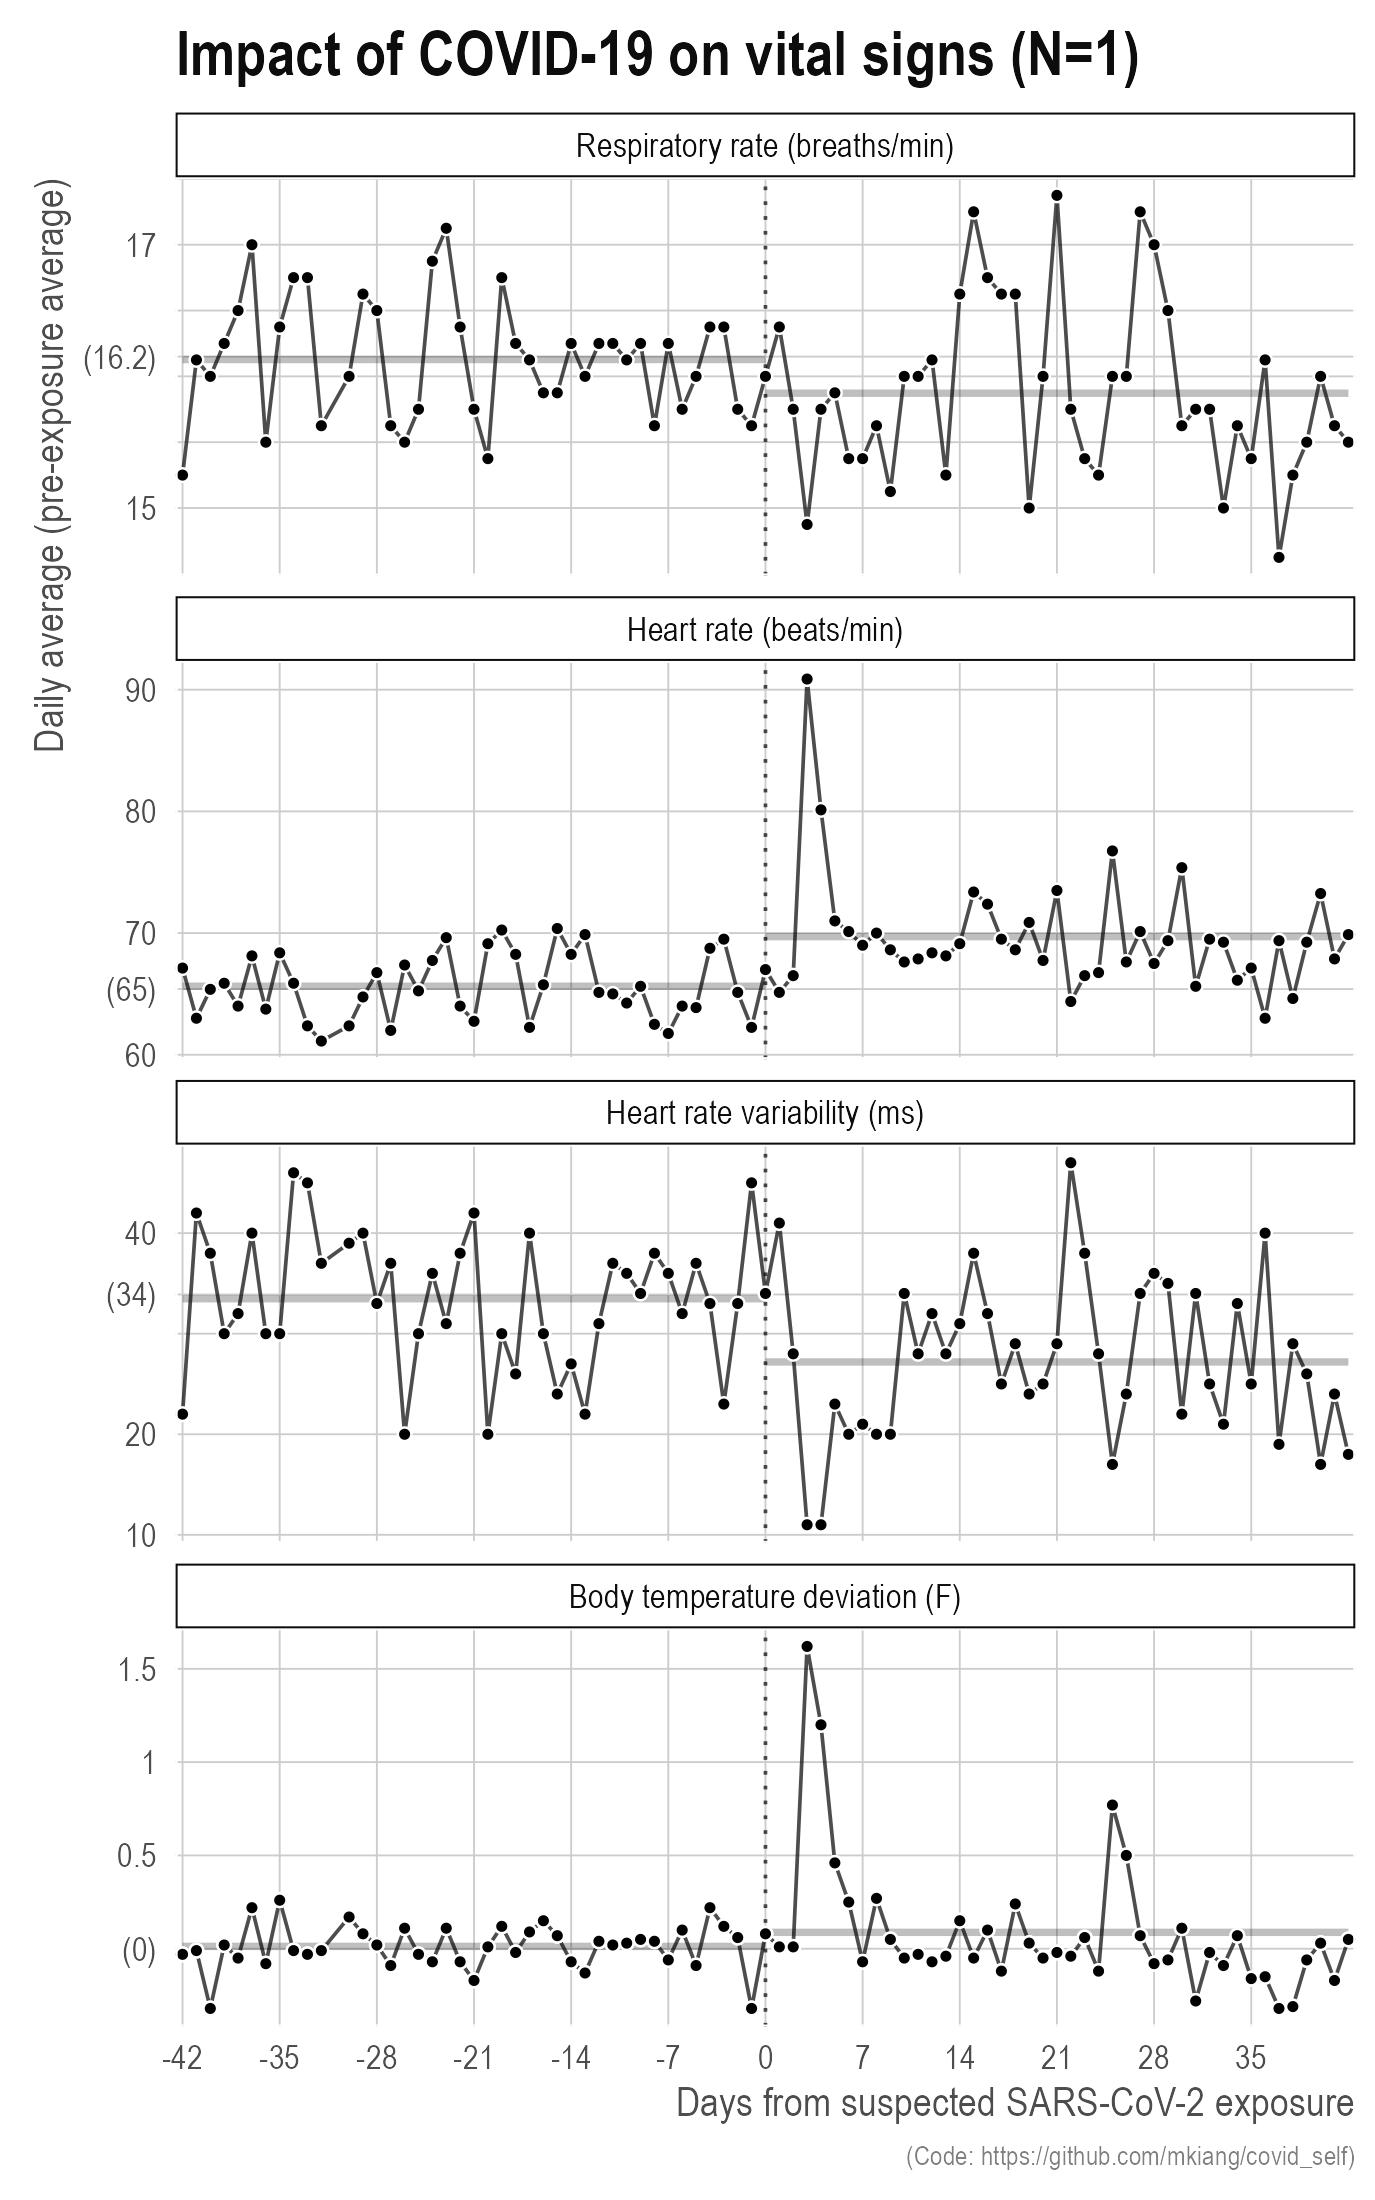
As you can see, for a few things, even six weeks after exposure, I did not return to my pre-exposure baseline. My respiratory rate was slightly lower, my average heart rate was (and actually still remains) slightly elevated, and my heart rate variability is still lower (higher is better). My temperature is more or less the same.
All of this resulted in decreased physical activity, which I plot below.
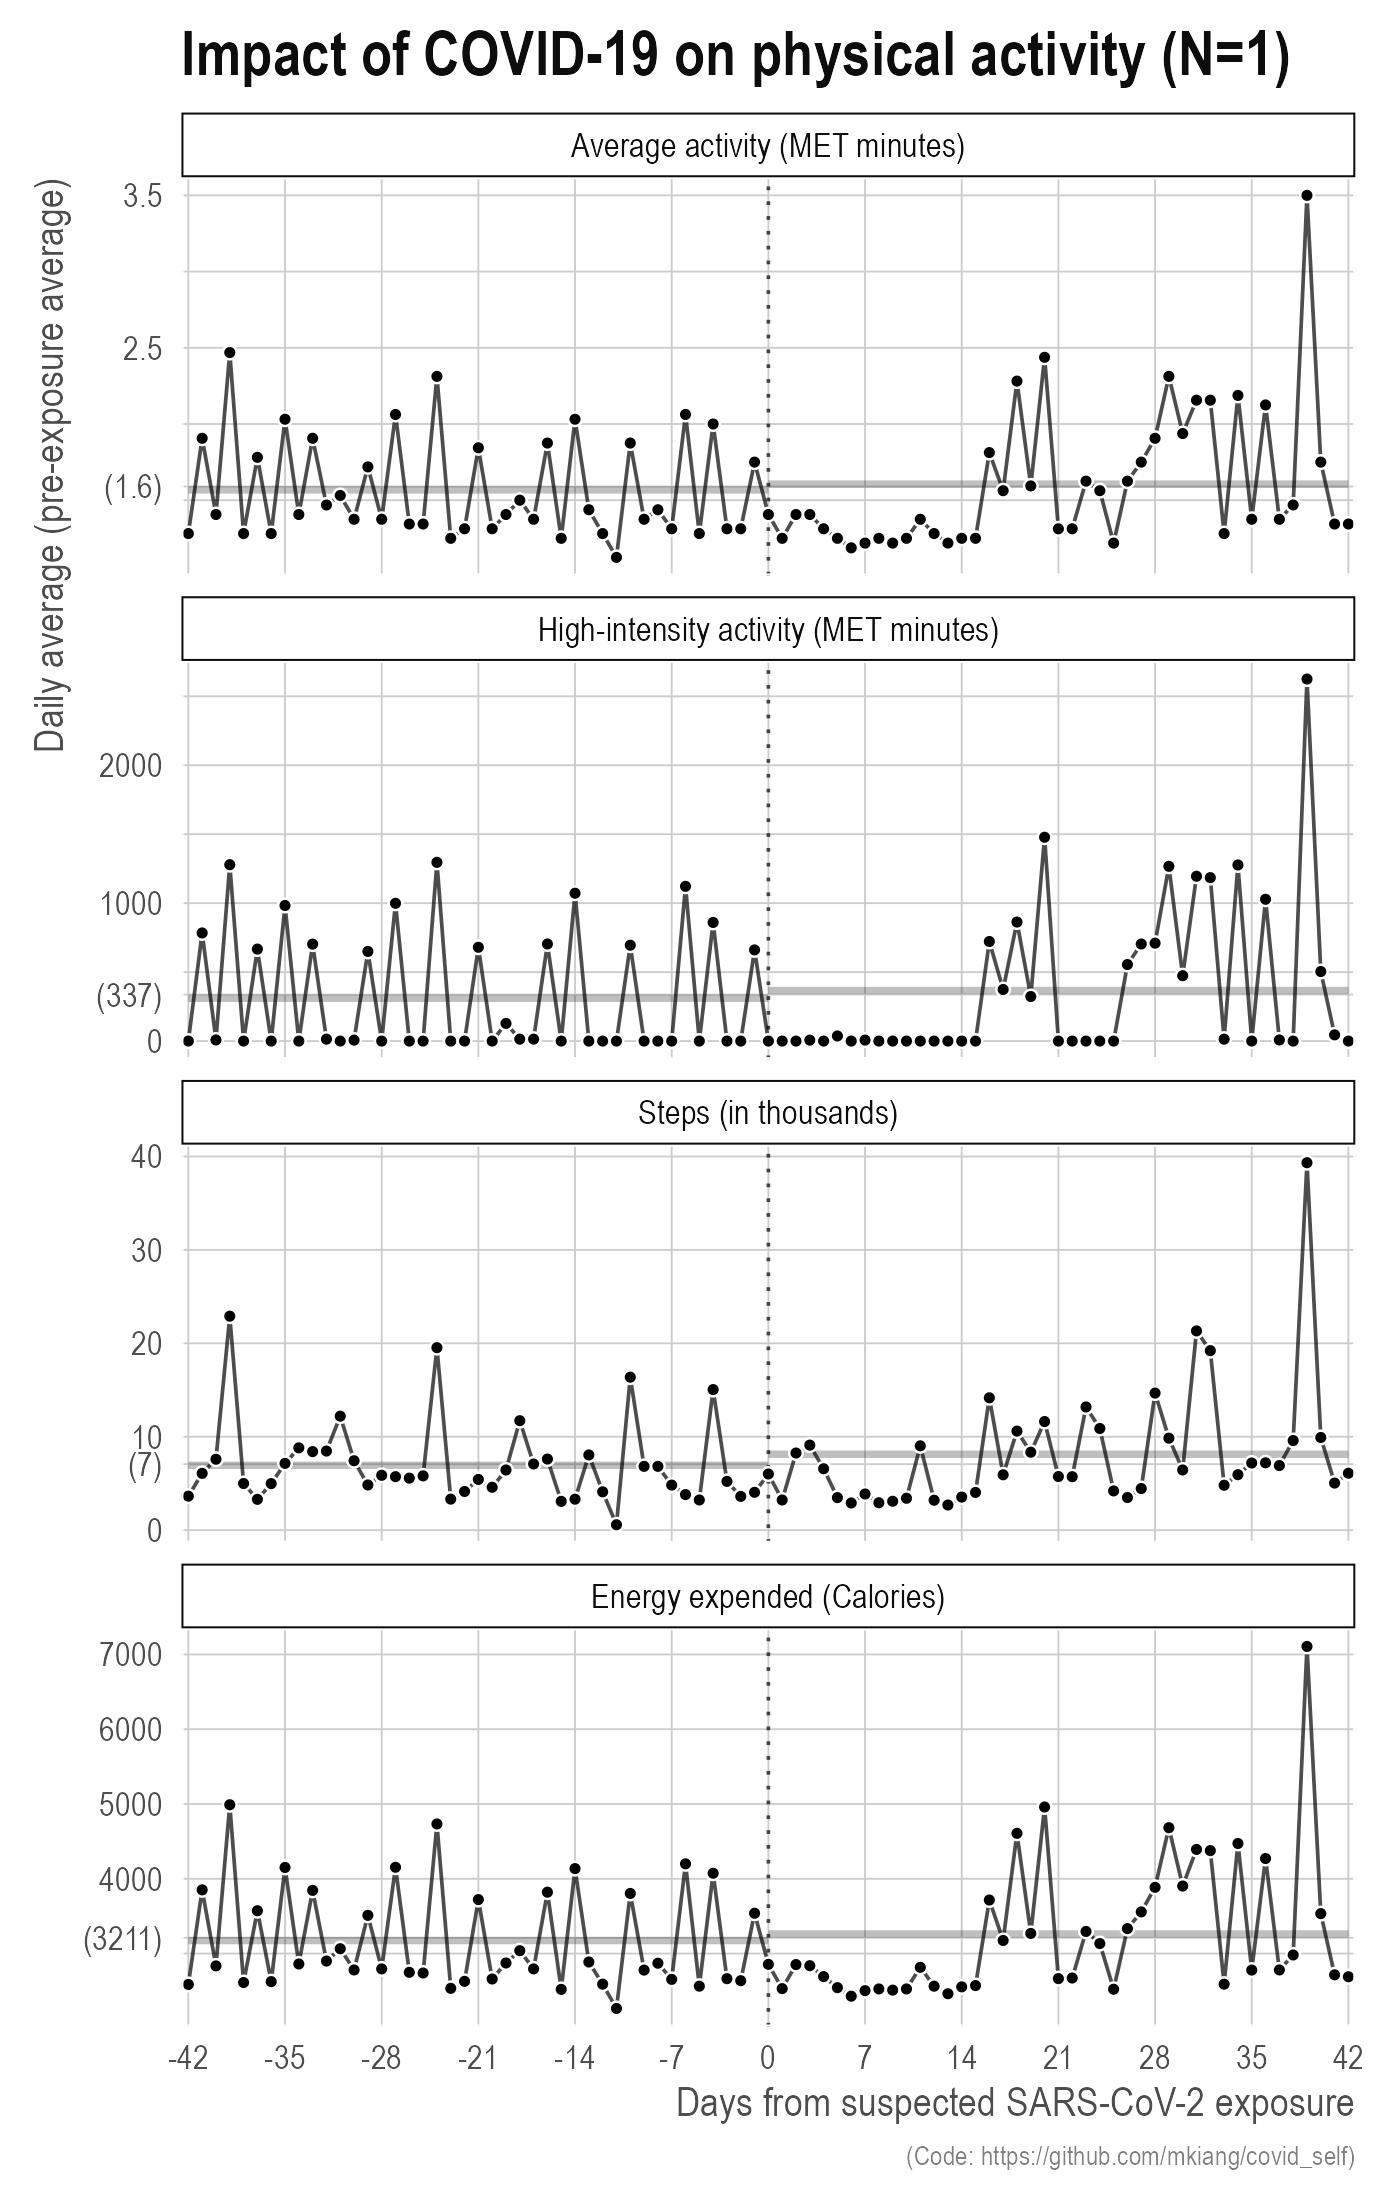
I eventually went back to my baseline level of physical activity for all different metrics, but as you can see in the MET minutes metrics, there was a fairly long period of inactivity where it felt like my heart was not ready for intense exercise.
So, COVID-19: 1/10 — would not recommend.