
Still, every resident within 10 minutes walking distance to a park is quite the feat — especially since San Francisco has a larger population (about 820,000 people), a smaller land area, and more complex topology (~1,000 feet elevation change) than the other places.
As somebody who frequents the local parks quite often, one thing the nearest-walking-distance metric doesn’t capture is the diversity of parks in San Francisco. For example, within 10 minutes of my apartment, there are parks where you can listen to stadium concerts for free, enjoy a manmade beach that looks across the bay, go to one of the largest kids’ playgrounds in the city, picnic to live entertainment during a Warriors game, or grab a beer and lunch from some food trucks.
This did make me a bit curious though — is my neighborhood unique?
Using park location data from OpenStreetMaps (left) and blockgroup-level population data from the US Census (right), I ran a local OSRM server to calculate the walking distance from every blockgroup to every park.
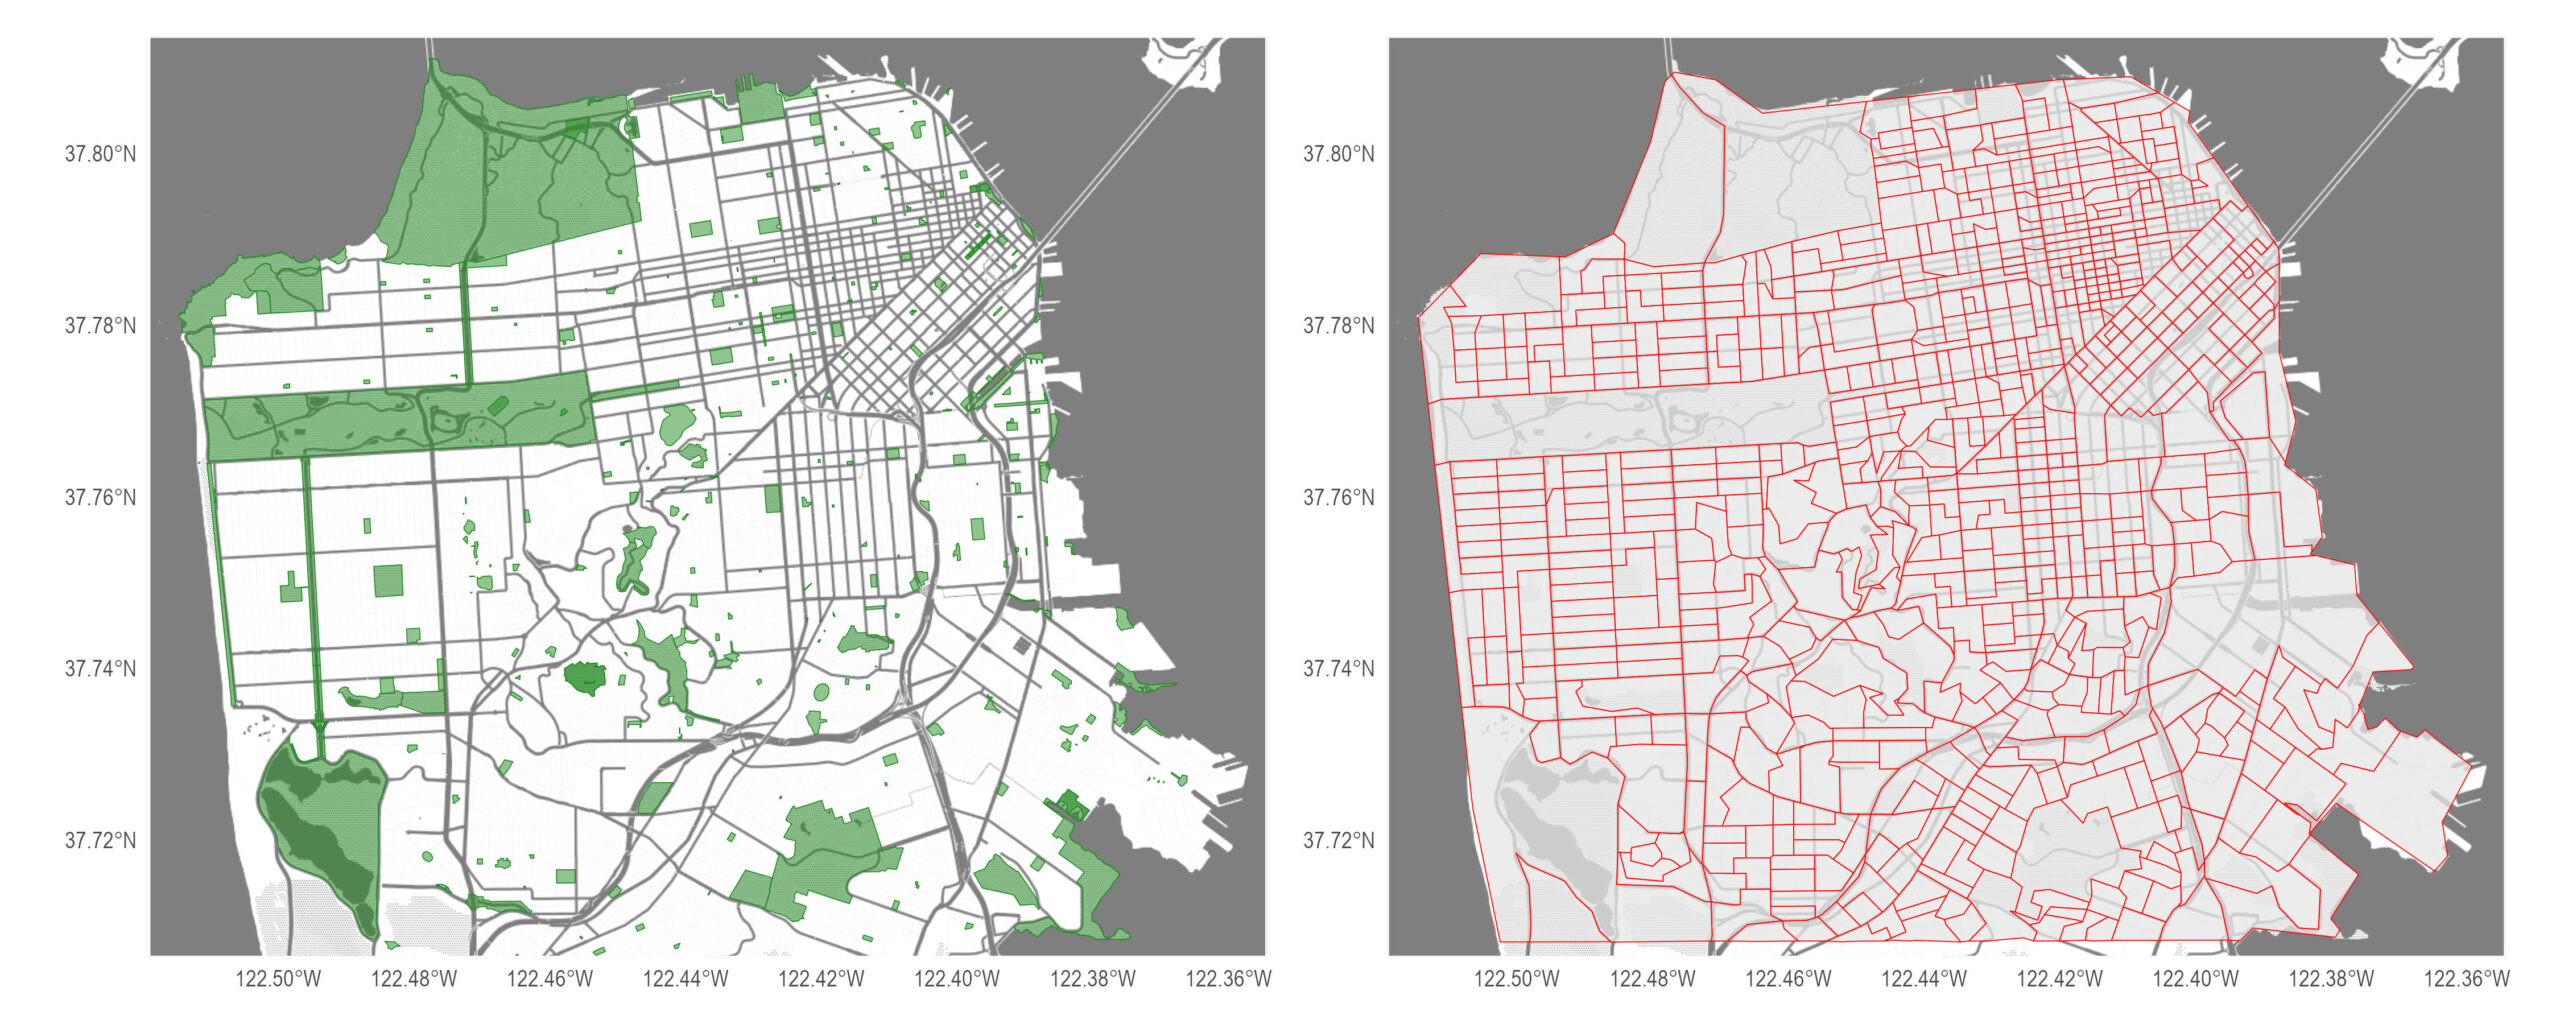
OpenStreetMap categorizes 345 unique areas as parks while the US Census breaks the city up into 676 unique blockgroups. To calculate the walking distance, I had to make a few assumptions. First, I use the centroid of each blockgroup which implicitly assumes the underlying population is uniformly distributed within the polygon. For the most part, this assumption is probably fine but there are a handful of blockgroups where it is clearly wrong. Second, I assume a person is “in” a park if they touch any part of the park — that is, I’m ignoring park entrances. This assumption is probably fine. Third, I exclude Treasure Island (because pedestrians cannot walk on the Bay Bridge). Lastly, OSRM assumes every street is walkable and minimizes walking time rather than other human factors such as hilliness, sidewalk condition, etc.
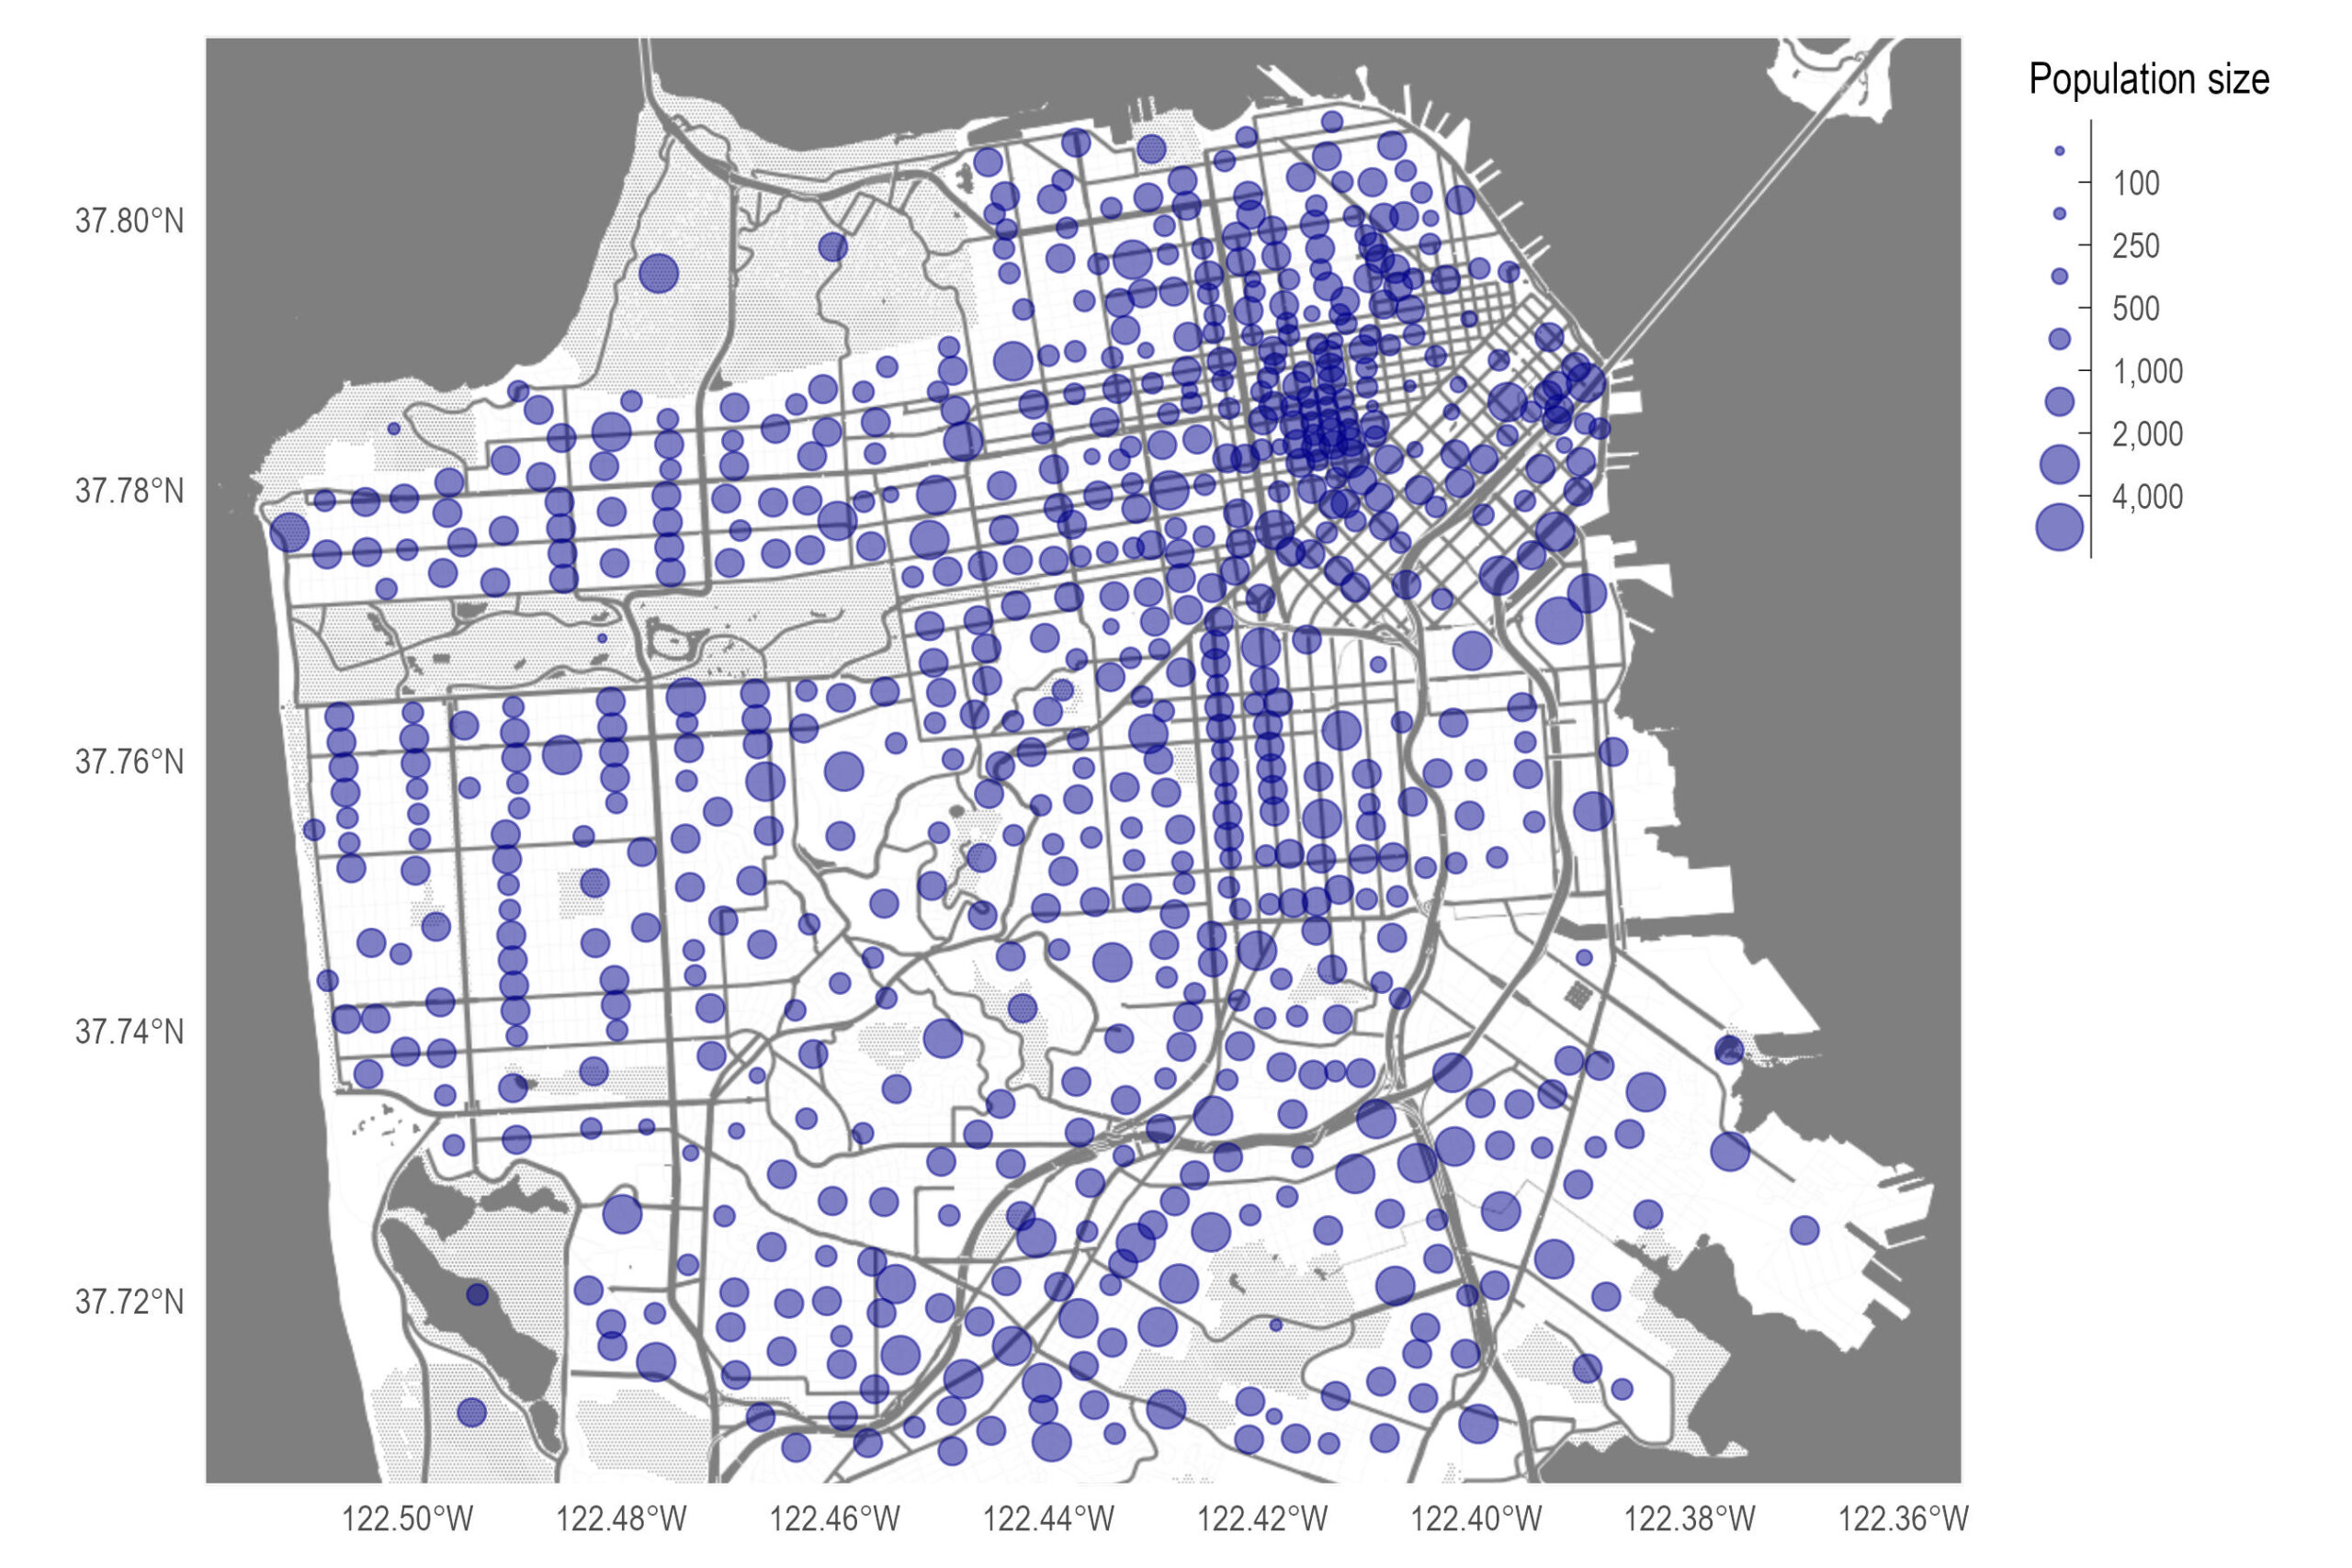
Here, I show the centroids of the blockgroups where the size is the population within that blockgroup. For most blockgroups, assuming the centroid looks fine — especially in dense areas (downtown) or highly residential areas (the Sunset), but there are a few where this is clearly wrong. For example, the centroid in the lower left is located in a lake.
Distances to the nearest parks
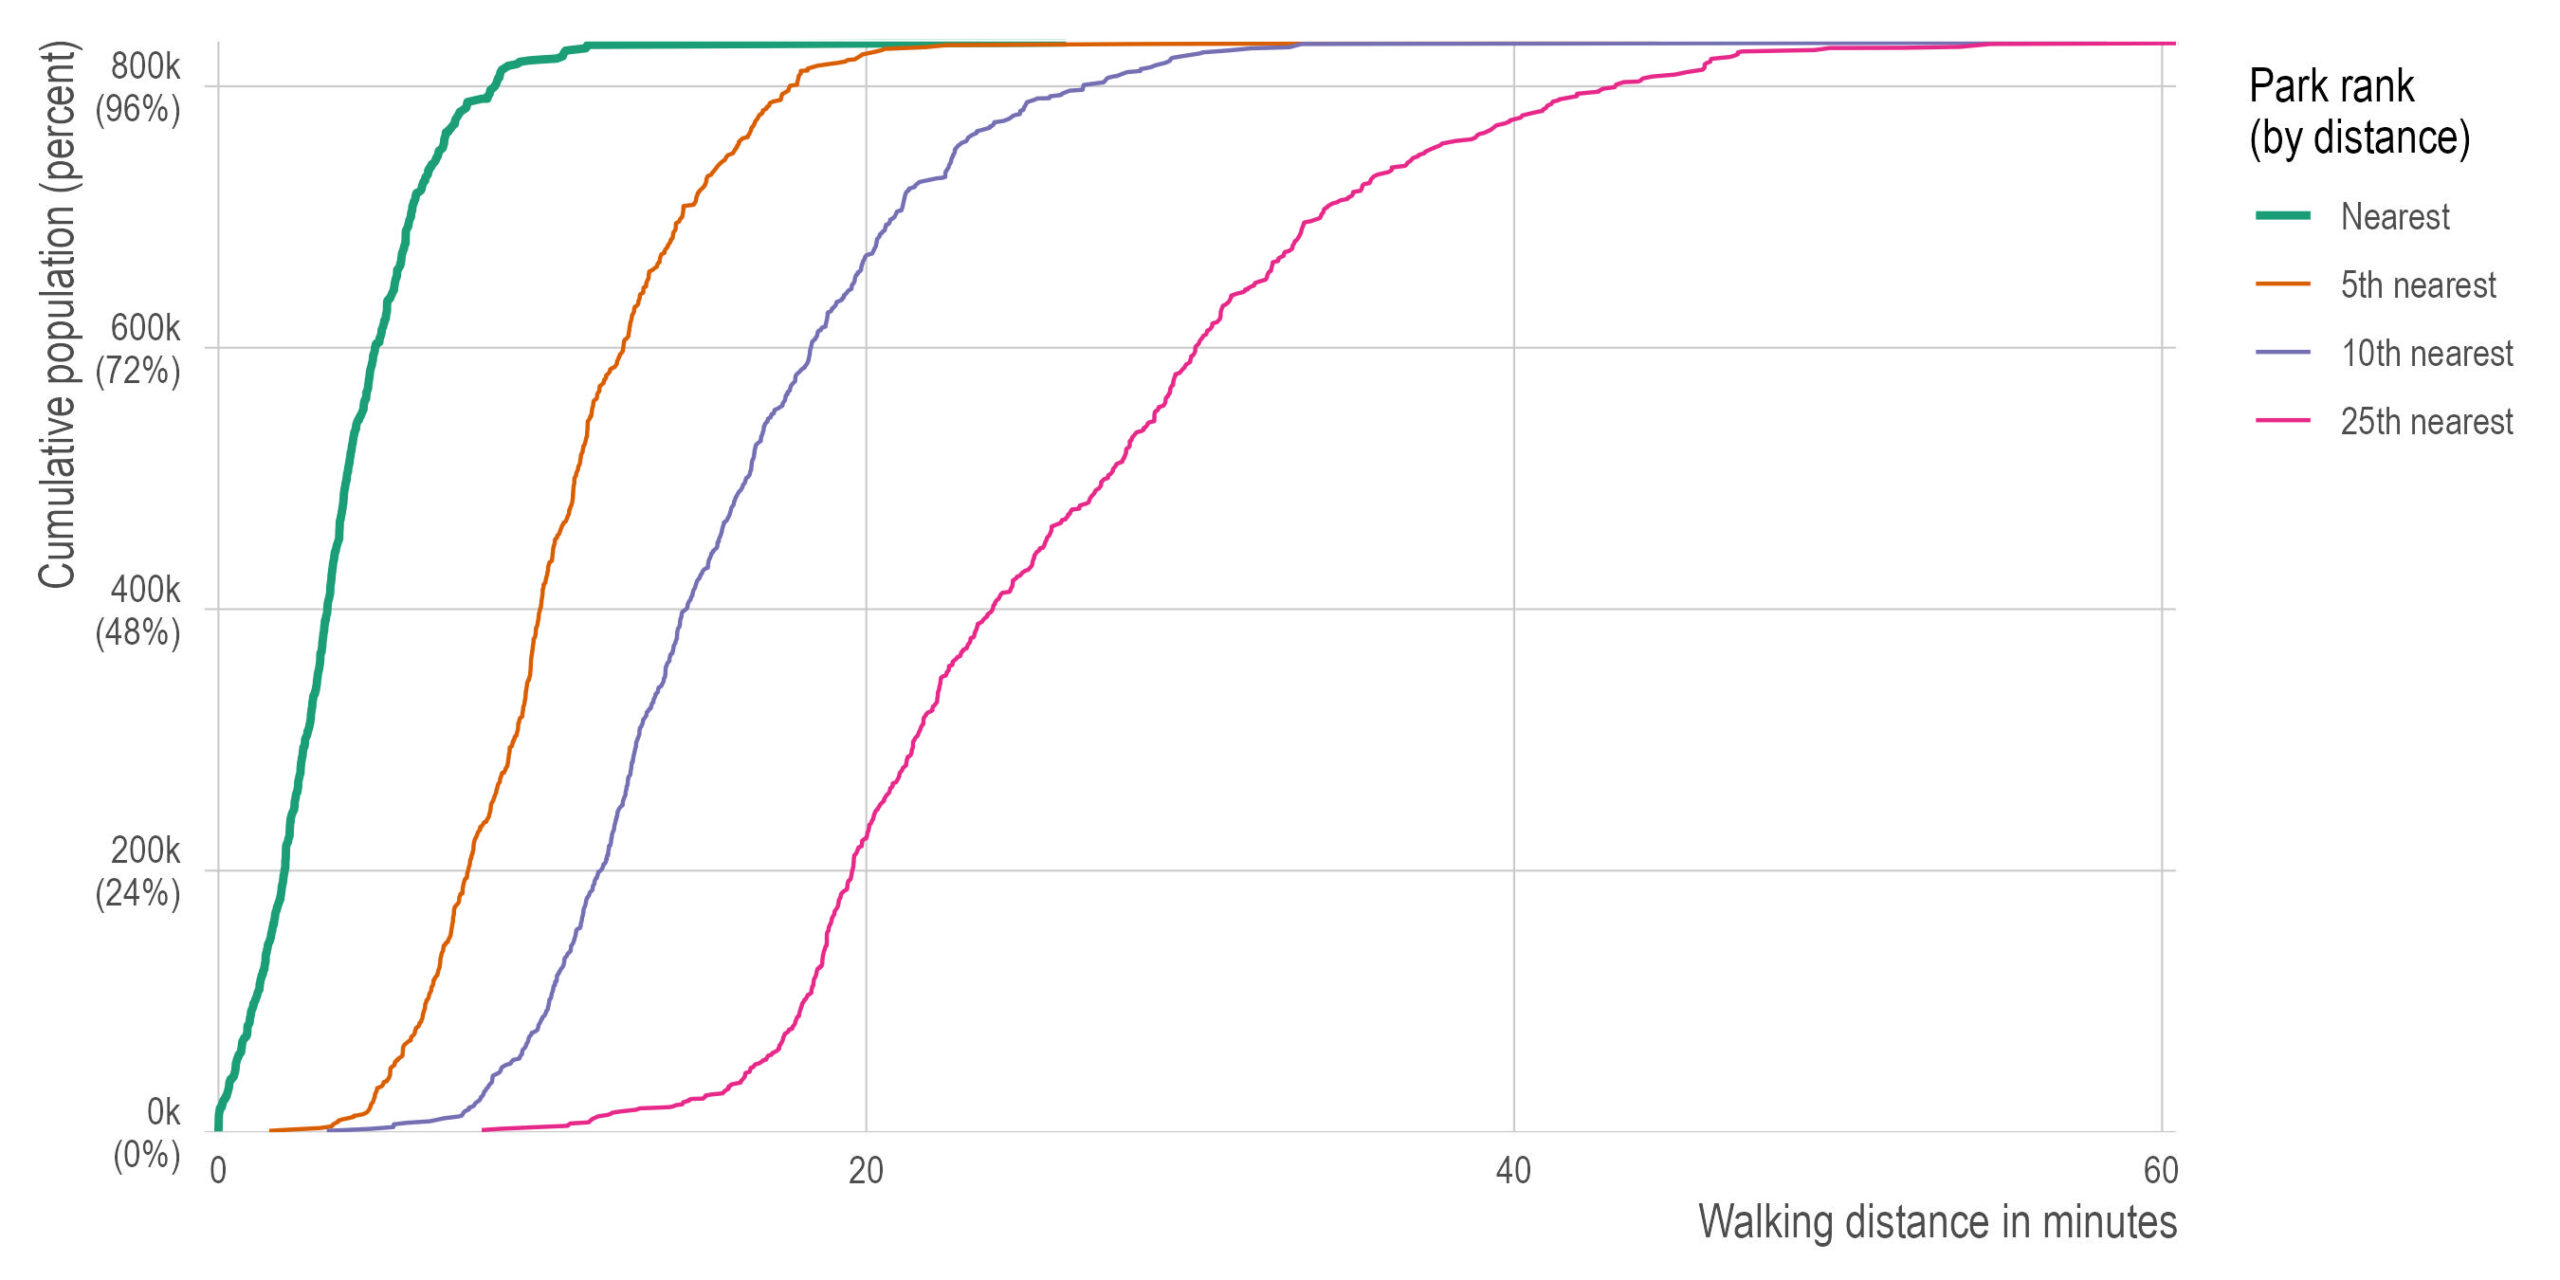
Below, I plot the cumulative population (y-axis) that is within some walking distance to a park (x-axis) for the nearest, 5th nearest, 10th nearest, or 25th nearest park (lines). For example, the thicker green line shows that about 98% of SF residents are within 10 minutes walking to a park. My number is a little different than the official numbers but it’s pretty close and the official city numbers are likely more accurate (since they know the exact address of all residential units).
More interesting to me, this figure also shows that 99% of SF residents live within 20 minutes walking to five different parks. In fact, about half of all SF residents live within 10 minutes walking distance to five different parks. About half of all SF residents live within 15 minutes of 10 parks and about a quarter live within 20 minutes of 25 different parks (!!). Nearly every SF resident could walk to 10 different parks within 30 minutes and to 25 different parks within an hour. Not only do residents have access to a park but most have access to multiple parks.
Routes to the nearest parks
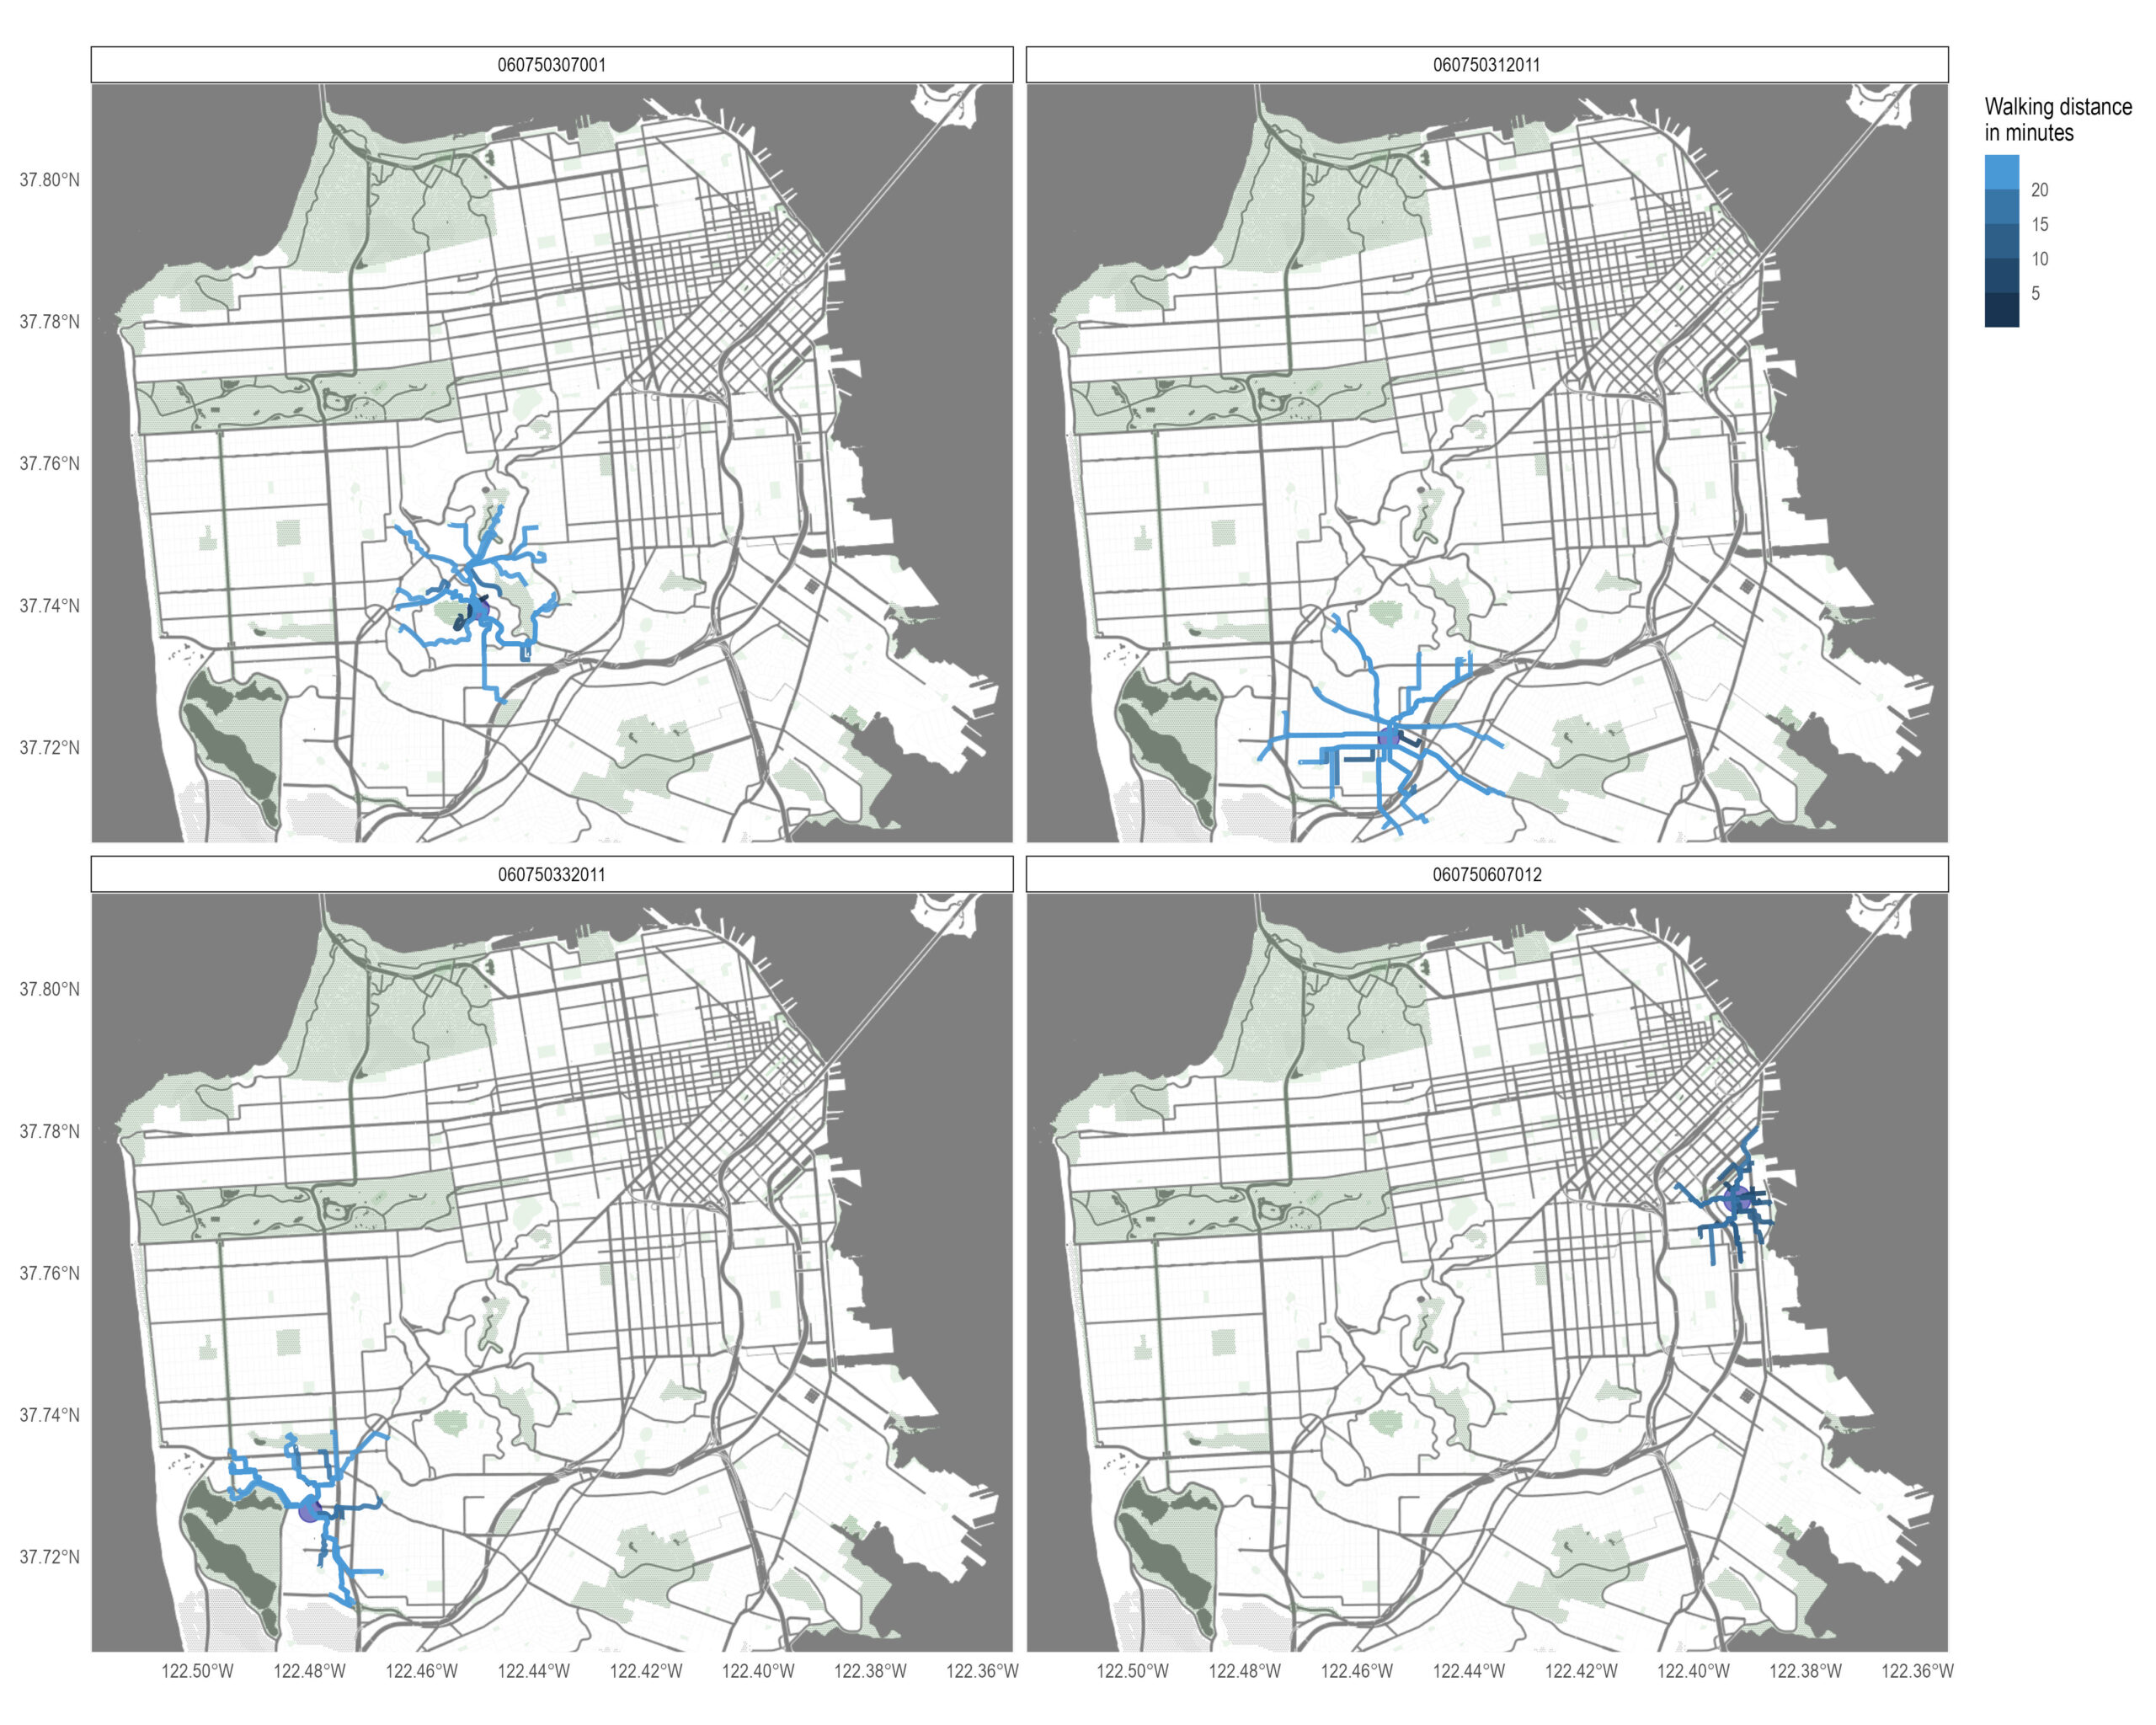
Here, I show the top four most populous blockgroups (facets) and the routes (lines) to the 20 nearest parks, colored by the walking distance. Mission Bay (lower right facet) has a plethora of nearby parks to choose from — nearly all of the 20 nearest parks are within 15 minutes of walking time. In contrast, the other three areas have a handful of nearby parks but quickly drop off to longer walks.
Most accessible parks
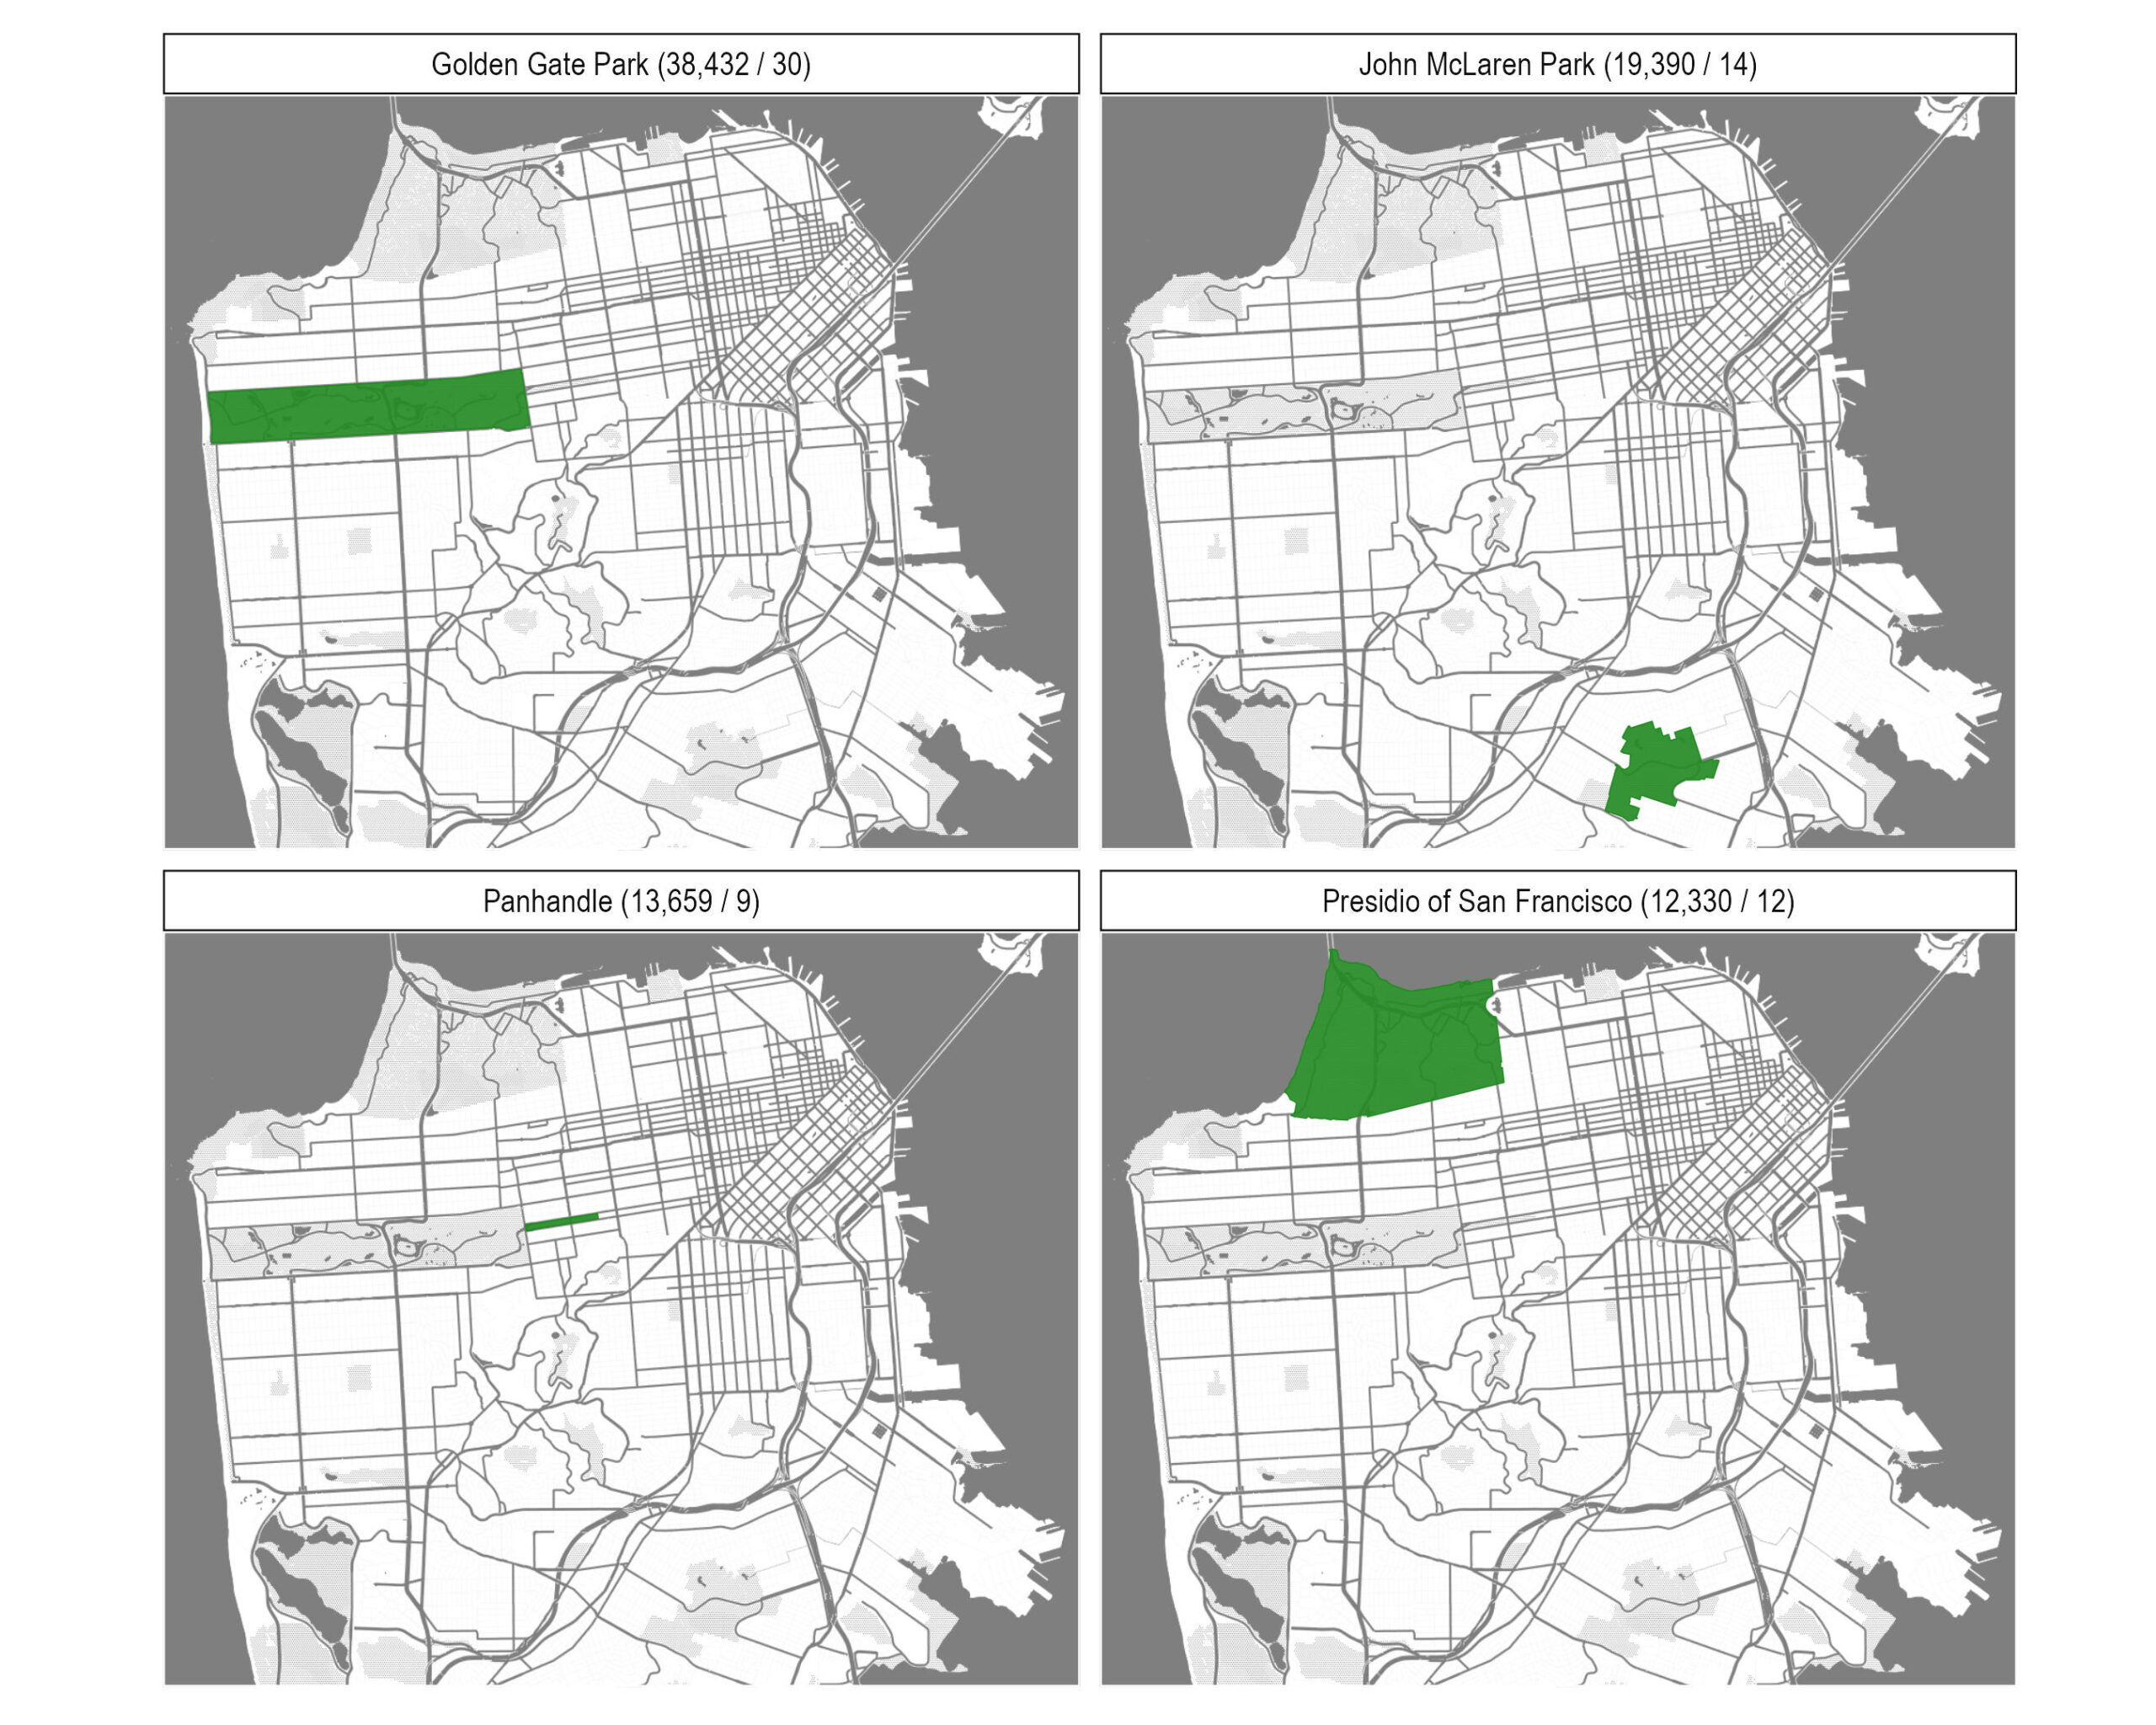
From the reverse perspective, we can ask which parks service the most people and/or blockgroups. Looking at the nine parks that serve at least 10,000 residents, four make a lot of sense. These parks have a lot of perimeter and touch a lot of different blockgroups. For example, Golden Gate Park (upper left) is the closest park for 30 different blockgroups that includes over 38,000 people. Similarly, McLaren Park is the nearest park for 14 blockgroups and includes over 19,000 people. The Panhandle (bottom left) is much smaller (in terms of total area) but has a reasonably large perimeter and is located in a moderately dense part of the city. Only half of the Presidio’s perimeter touches land but it’s so large that it still the closest park to 12 blockgroups and 12,000 people.
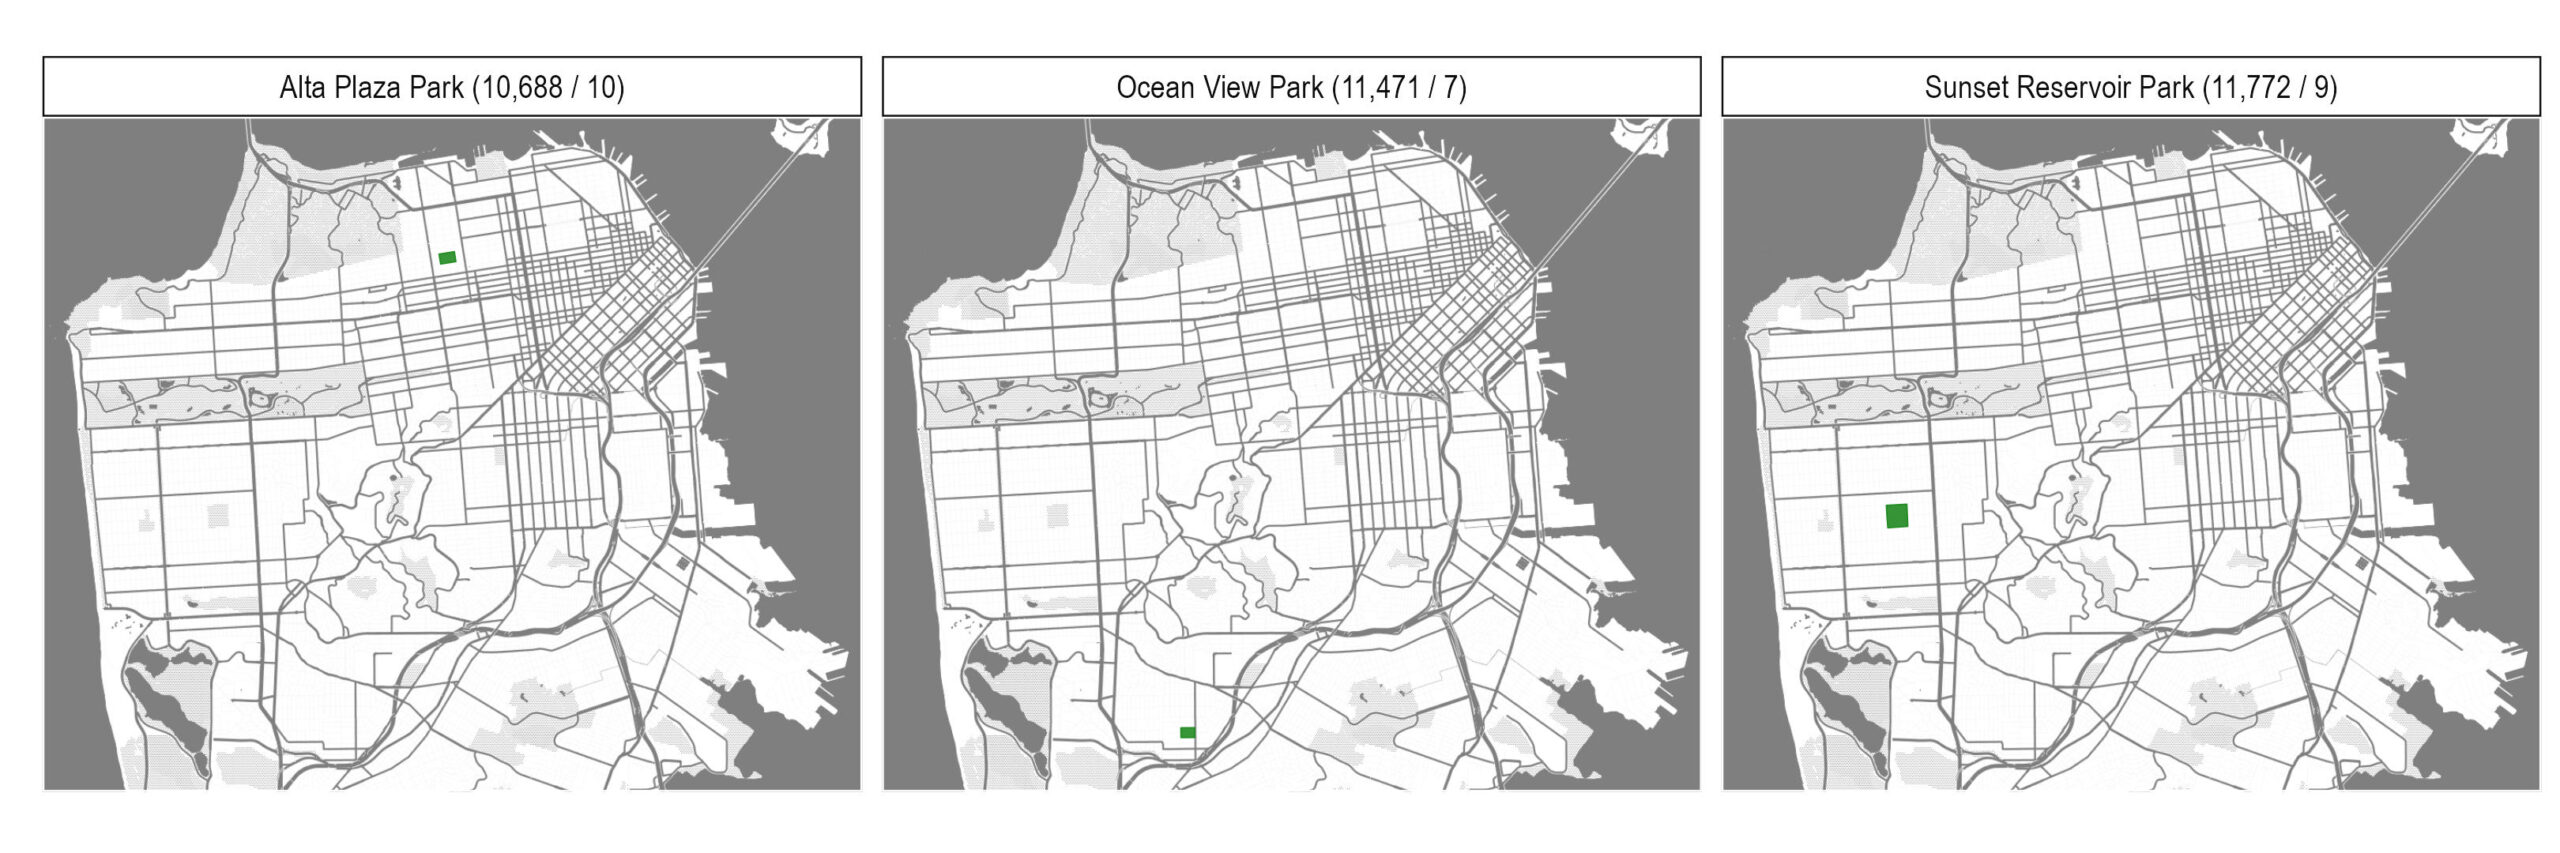
Compare these large parks to these three “neighborhood” parks, which act as large community spaces for the neighboring area. These parks are not so large as to be attractions in and of themselves (unlike the Presidio or Golden Gate Park) but they are the largest park in their neighborhoods.
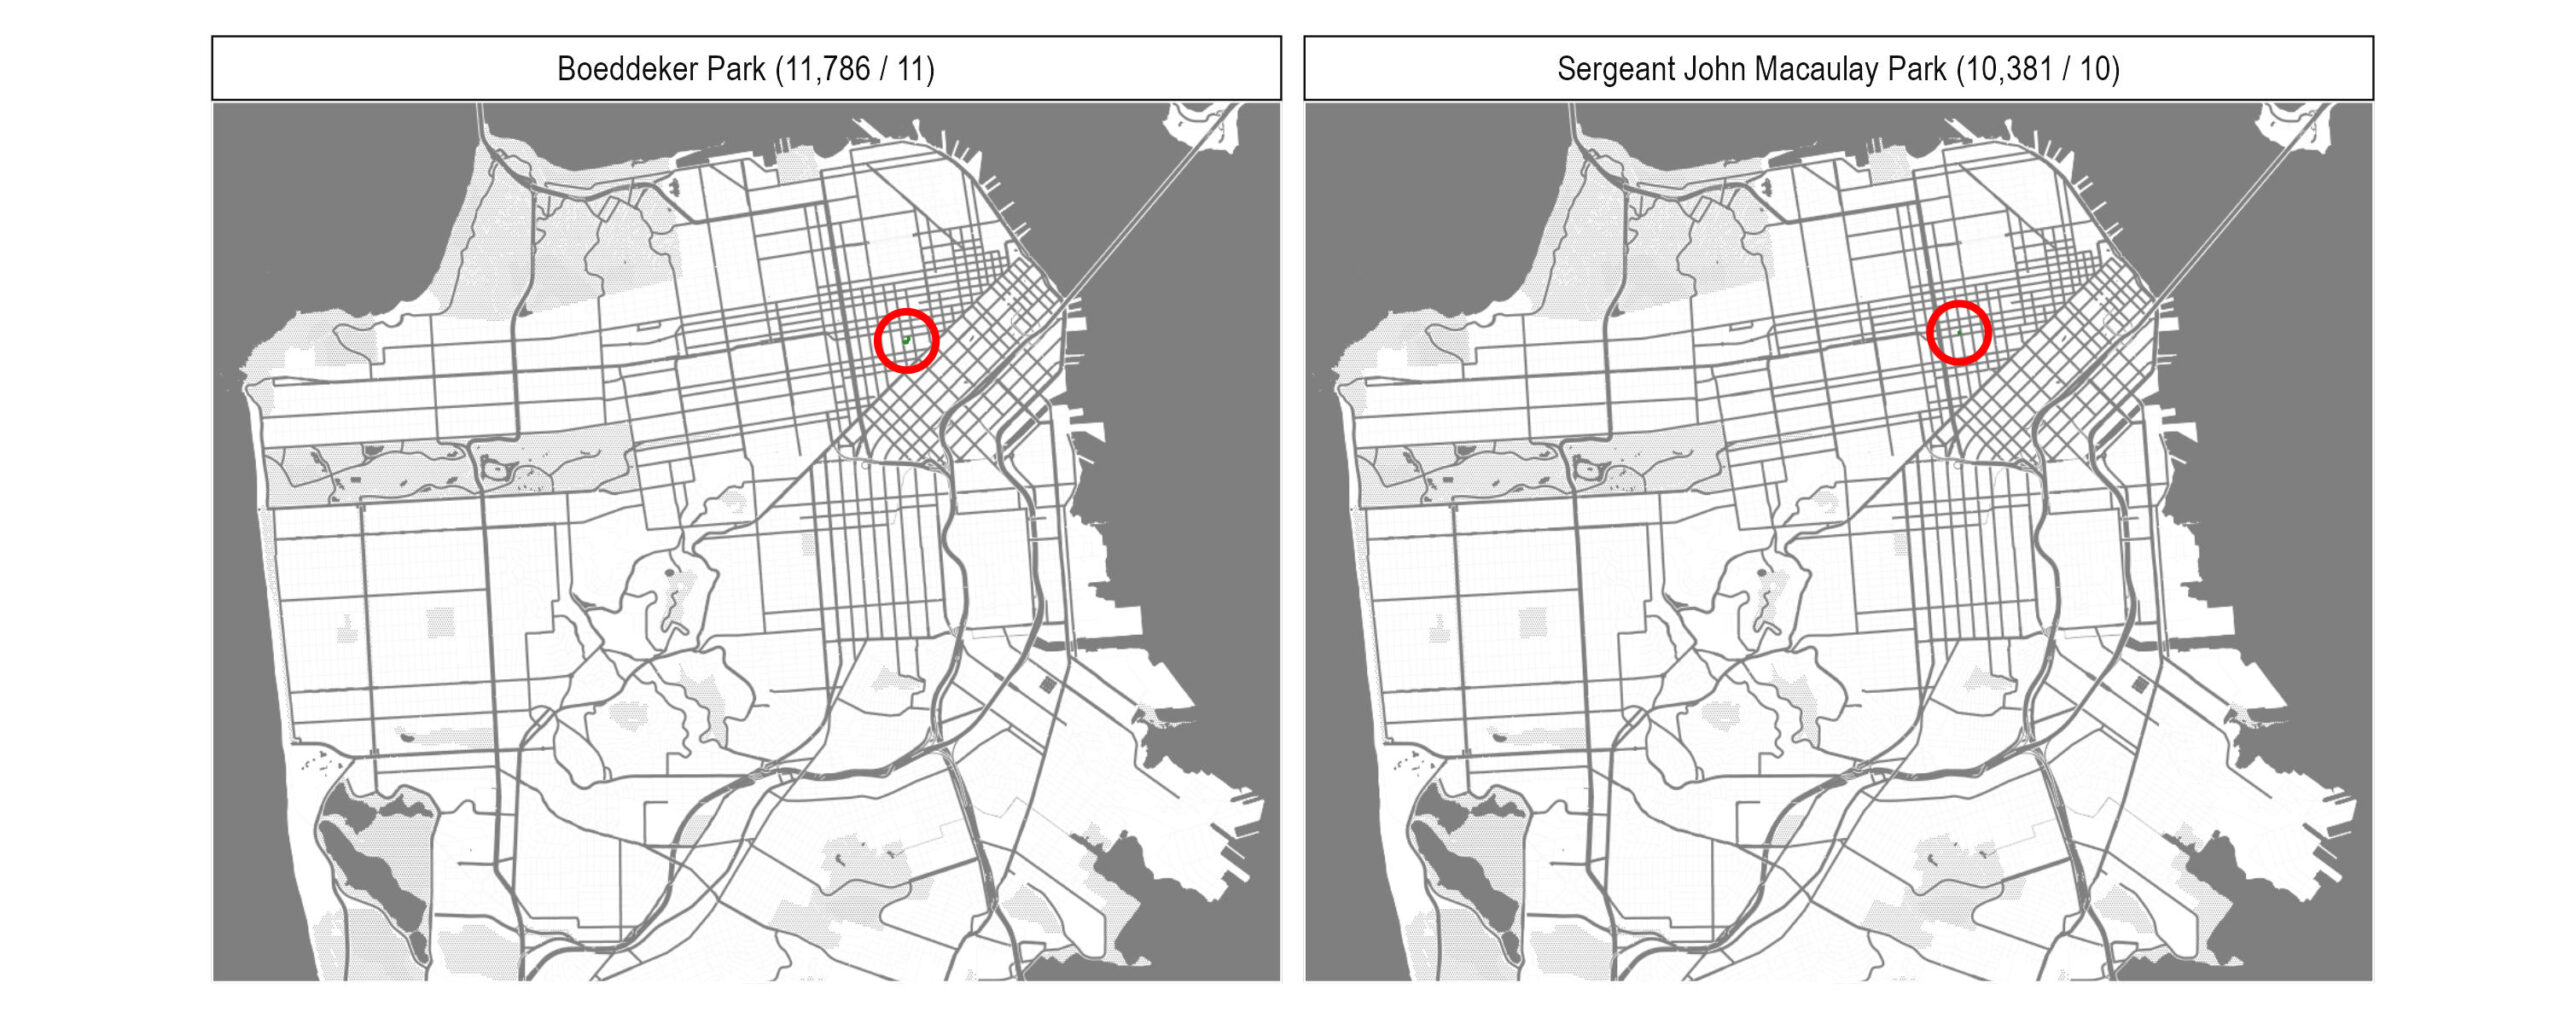
Lastly, take a look at these two tiny parks (they’re so small I had to add a red circle so I could see them). In terms of both total area and perimeter they are very small compared to all the other parks, but they still serve over 10,000 residents each and at least 10 different blockgroups. They’re located in the densest part of San Francisco.
In conclusion
Parks are good. We should have more of them. Different parks serve the community in different ways. Code and data available on my Github (with the caveat that you’ll have to run a local OSRM server to recalculate the distances).