· 4 min read

Collaboration network: 2025 edition

Looking back on what I think can be fairly described as a chaotic year (professionally), three events really encapsulated what it was like being in academia.

  • In January (2025), I was on an NIH study section that got cancelled as the new administration shook up HHS/CDC/NIH and did some mass grant cancellations. It eventually got rescheduled but I wasn’t able to attend — I can only assume it was as hectic as one would imagine.
  • Then in April, I was excited to start working on my second NASEM consensus committee. It got abruptly cancelled by the CDC the morning of our first meeting. This was, notably, after the whole committee was flown in from across the country the night before so couldn’t possibly have been a cost saving measure. We were never given a reason for the cancellation but I can only assume genetic blood disorders are woke.
  • Then in October, I was on another NIH study section that got cancelled — this time due to the government shutdown. It’s scheduled for later this month, but as a result of the condensed timeline, we’re reviewing ~40% fewer grants than we would normally discuss in study section.

This year has just started but it’s not shaping up to be any better professionally or personally.

Per tradition, here’s a quick look at the evolution of my collaboration network since 2010.

An animation stepping one year at a time from 2010 to 2025. The main panel is the coauthor network: blue nodes are papers, sized by citation count on a legend from 5 to 250, and red nodes are collaborators. Each year the papers and coauthors added that year light up while everything earlier fades to the background, so the network grows outward from a few small clusters. Five smaller panels advance in step: new manuscripts per year against a long-run average line, new collaborators per year against its own average, citations accumulating per paper as papers age, cumulative citations across all papers, and new citations each year. All five end higher than they start, with most of the growth after 2020.

Below is a plot of collaborations (circles) over time (x-axis) by collaborator (y-axis).
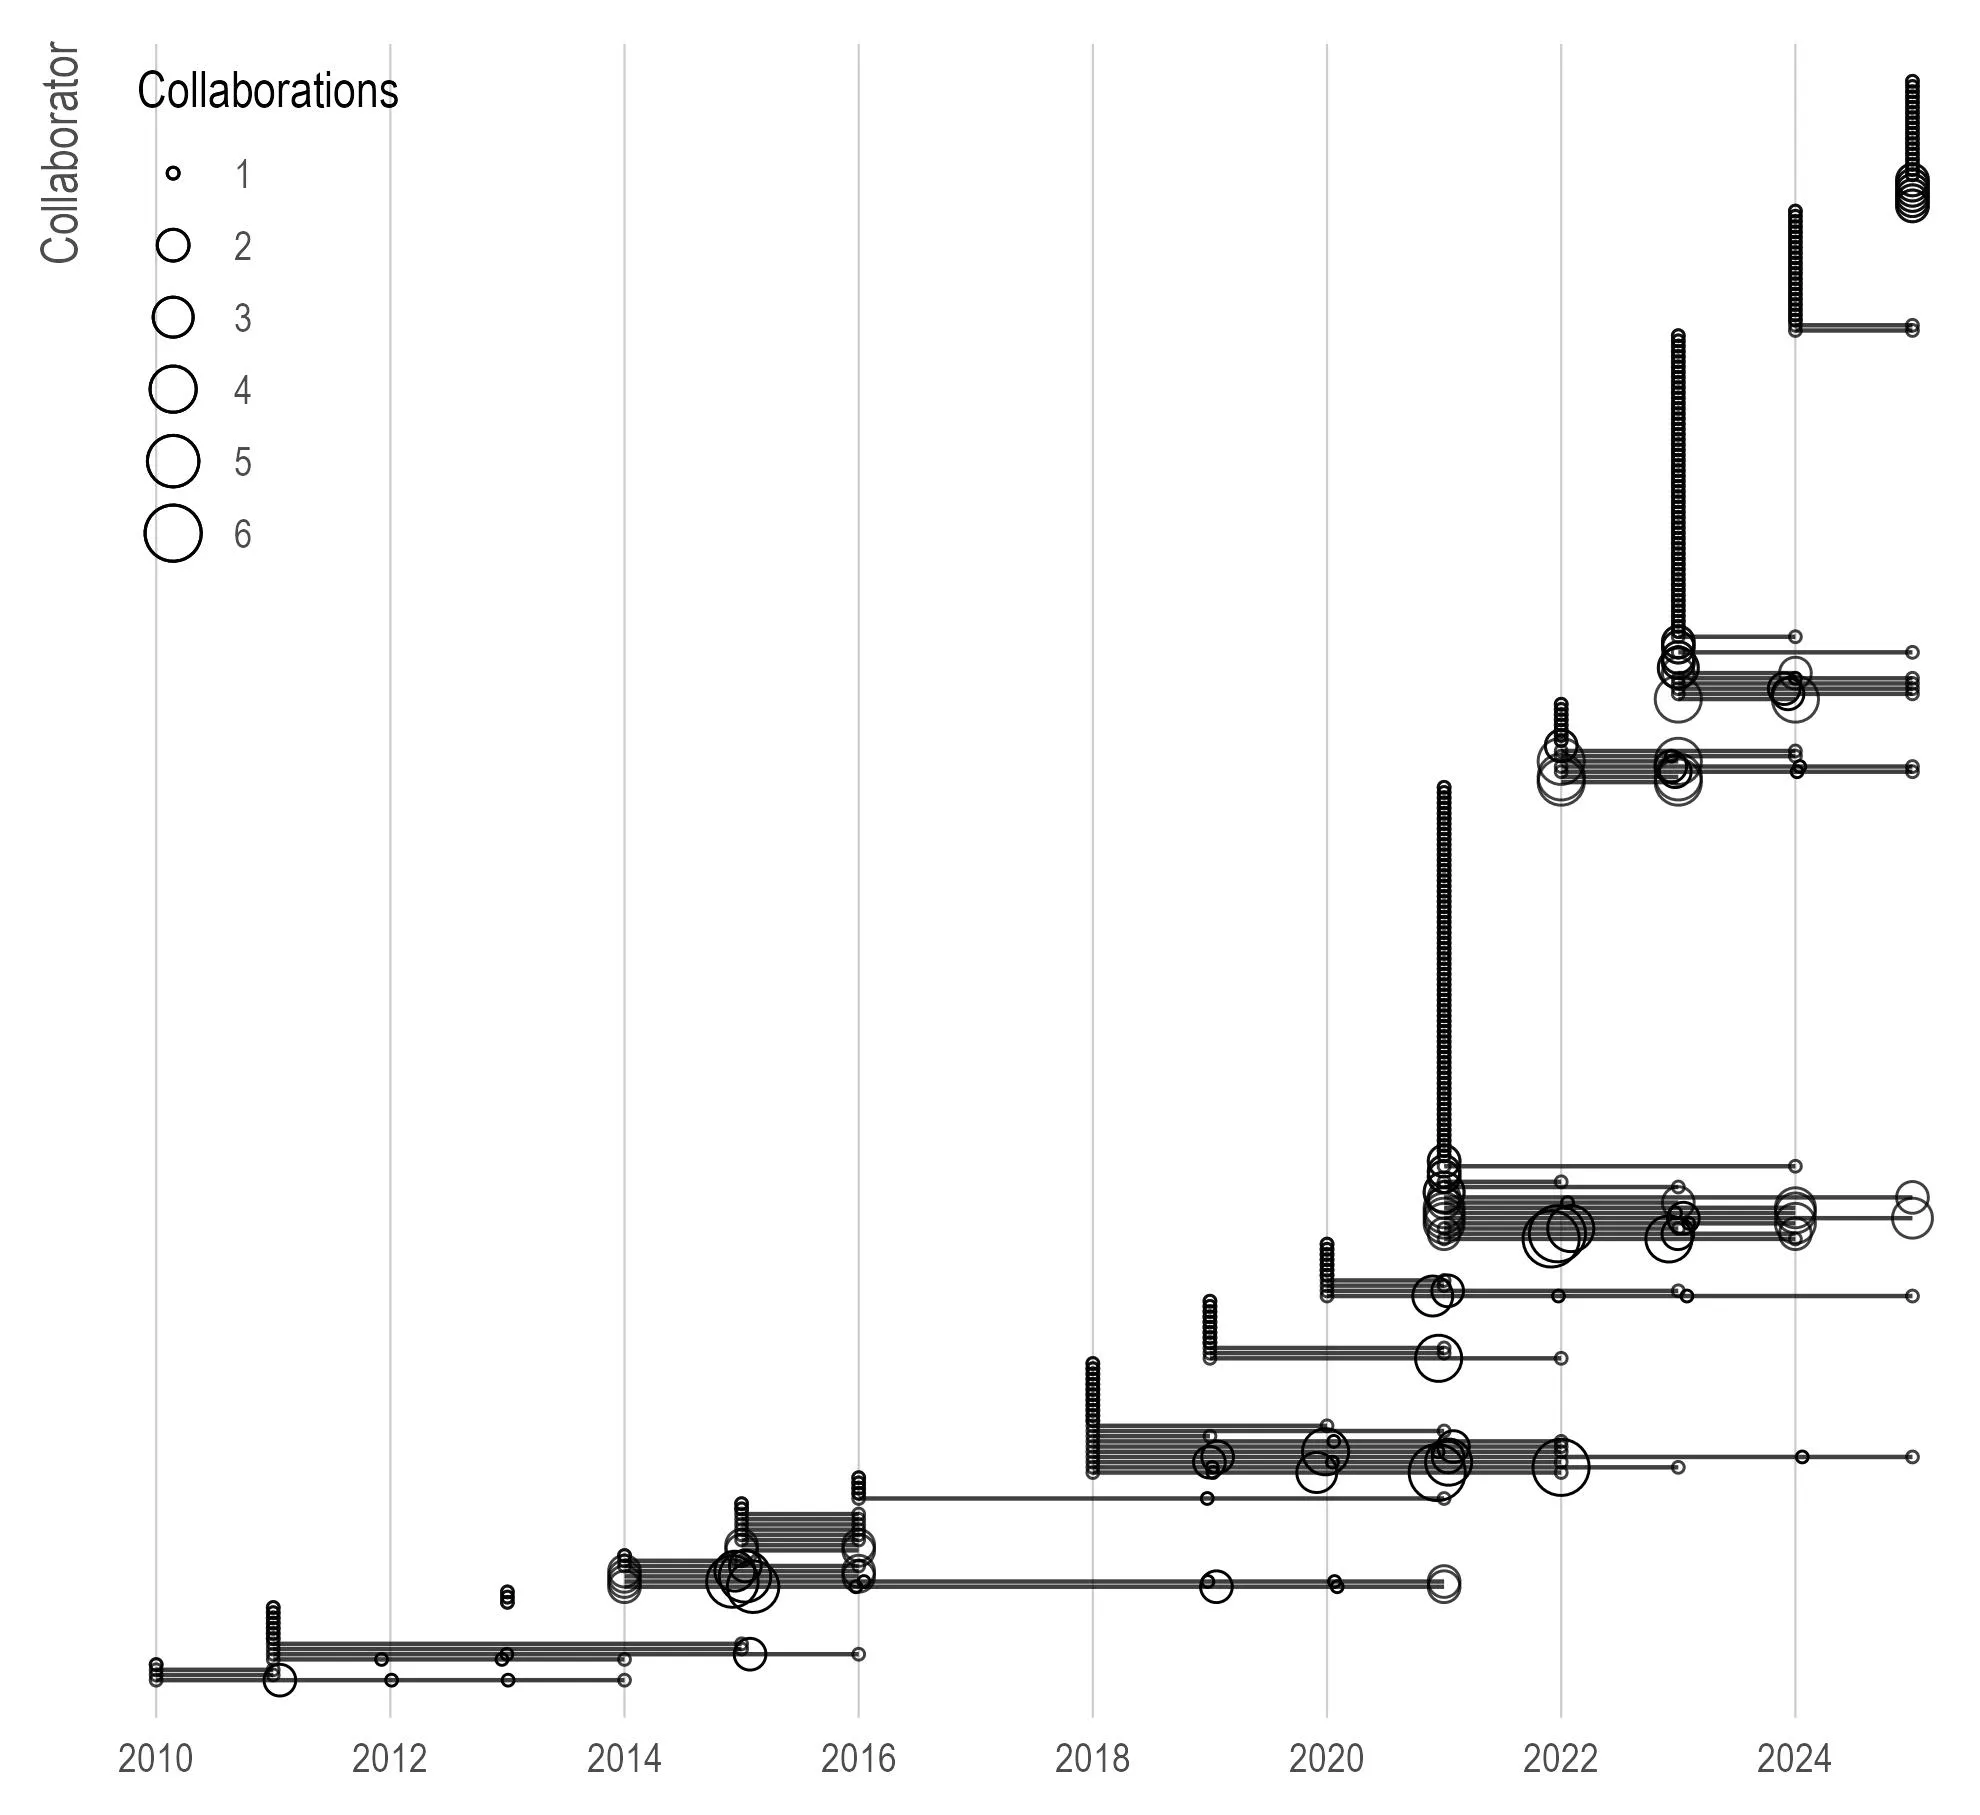
Collaborations over time, one row per collaborator with no names shown, from 2010 to 2025. Circle size is the number of collaborations that year, from 1 to 6, and a line joins each collaborator's first collaboration to their last; this version has no met-in-person legend. Vertical stacks of circles mark single papers with many coauthors, the tallest at 2018, 2021, 2023 and 2025. The rows are sparse before 2016 and crowd together from 2018 onward, so the whole picture steps upward to the right.

Here’s an upset plot of my most frequent collaborators (in terms of number of papers) and their different sets. It hasn’t changed all that much — still mostly comprised of people I no longer collaborate with but when we did, we were quite productive.
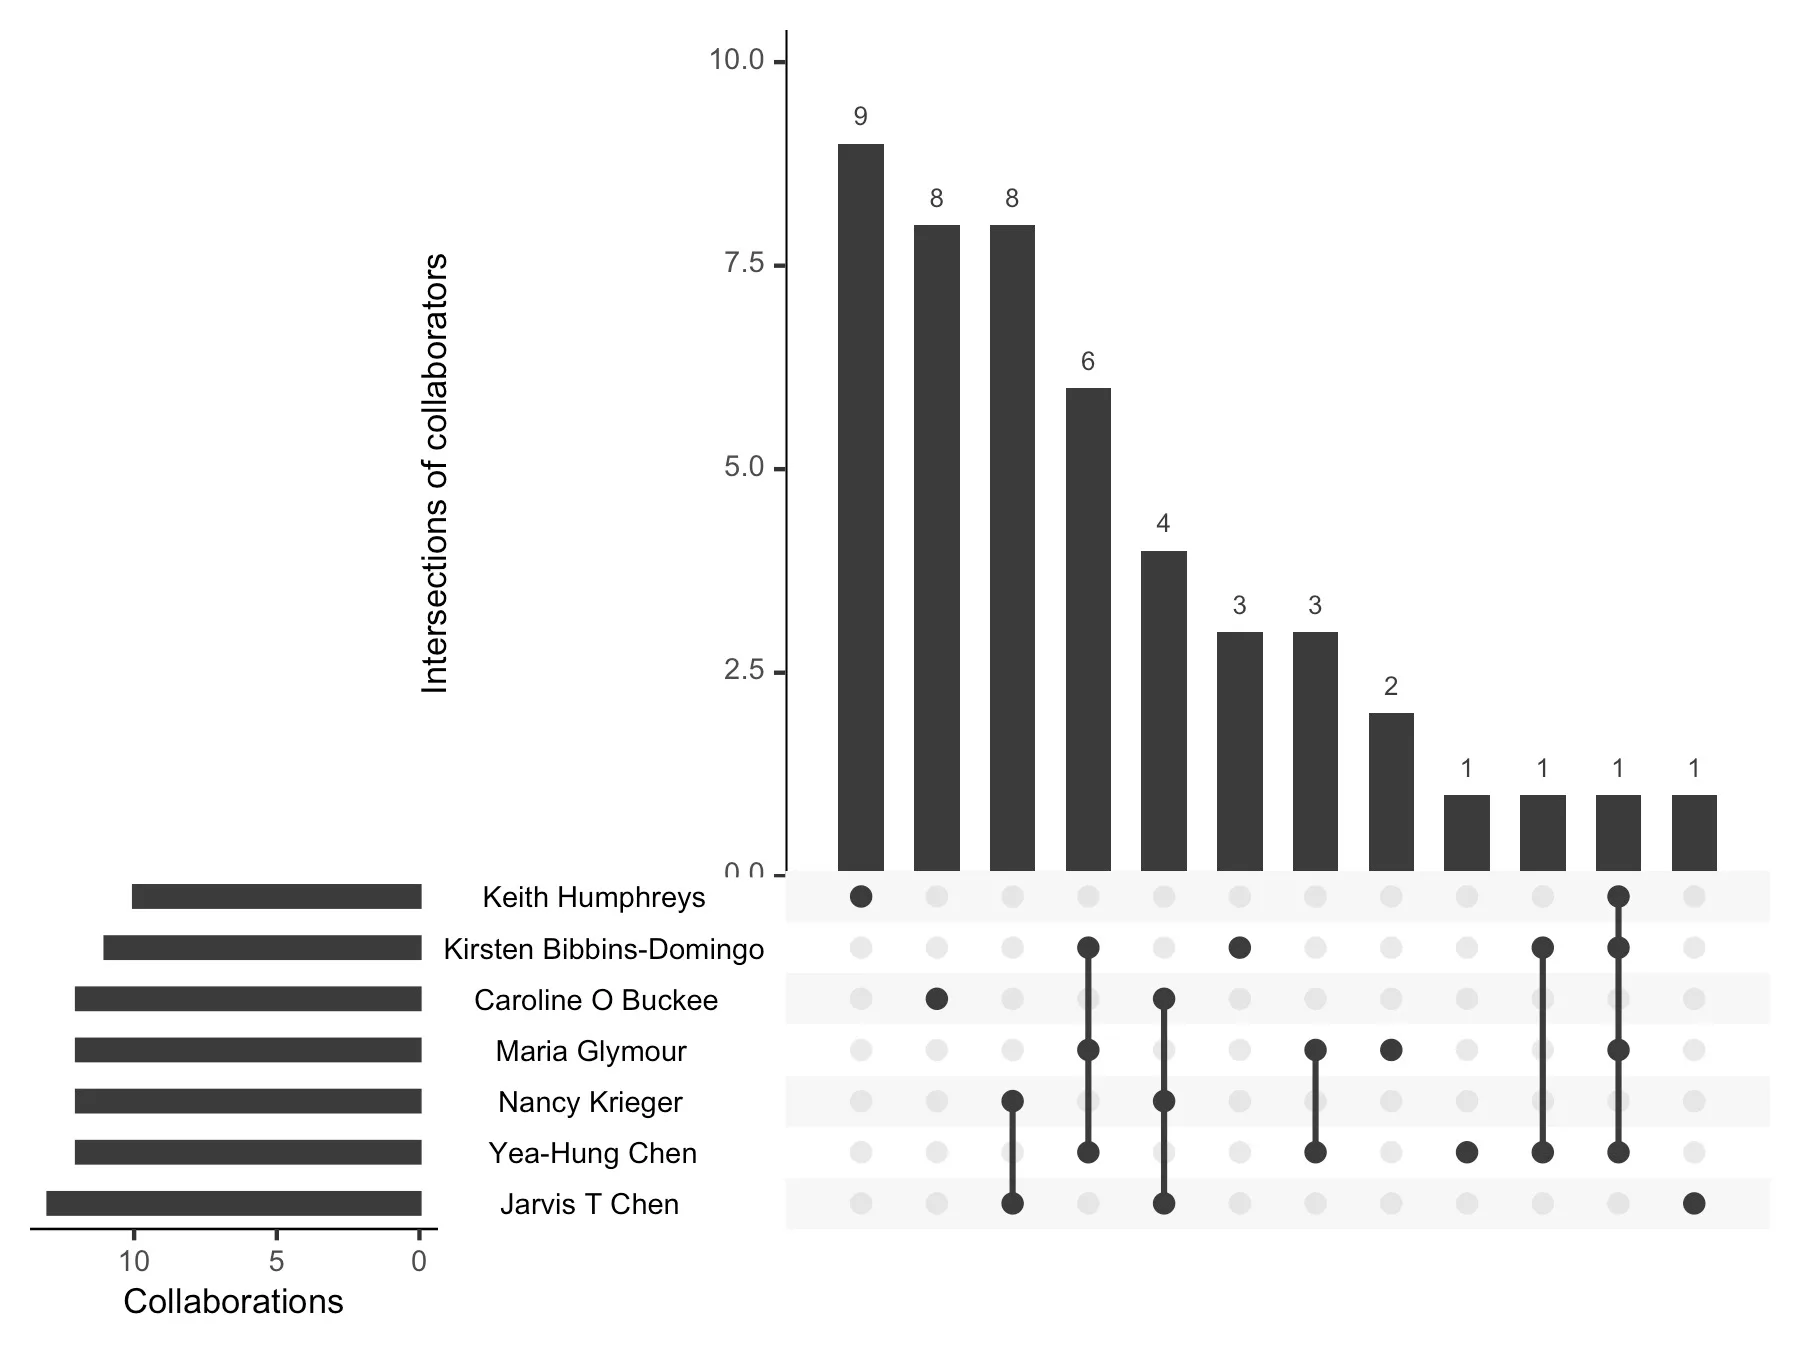
An UpSet plot of my seven most frequent coauthors, shown by name on the chart. Horizontal bars on the left give each person's total collaborations, all between about 10 and 13. Vertical bars above show how many papers each combination of those people appears on, from 9 down to 1, with connected dots marking which of them are in each combination.

Conditional on having more than one collaboration together, who are my “most efficient” collaborators in terms of average number of citations (per collaboration)?
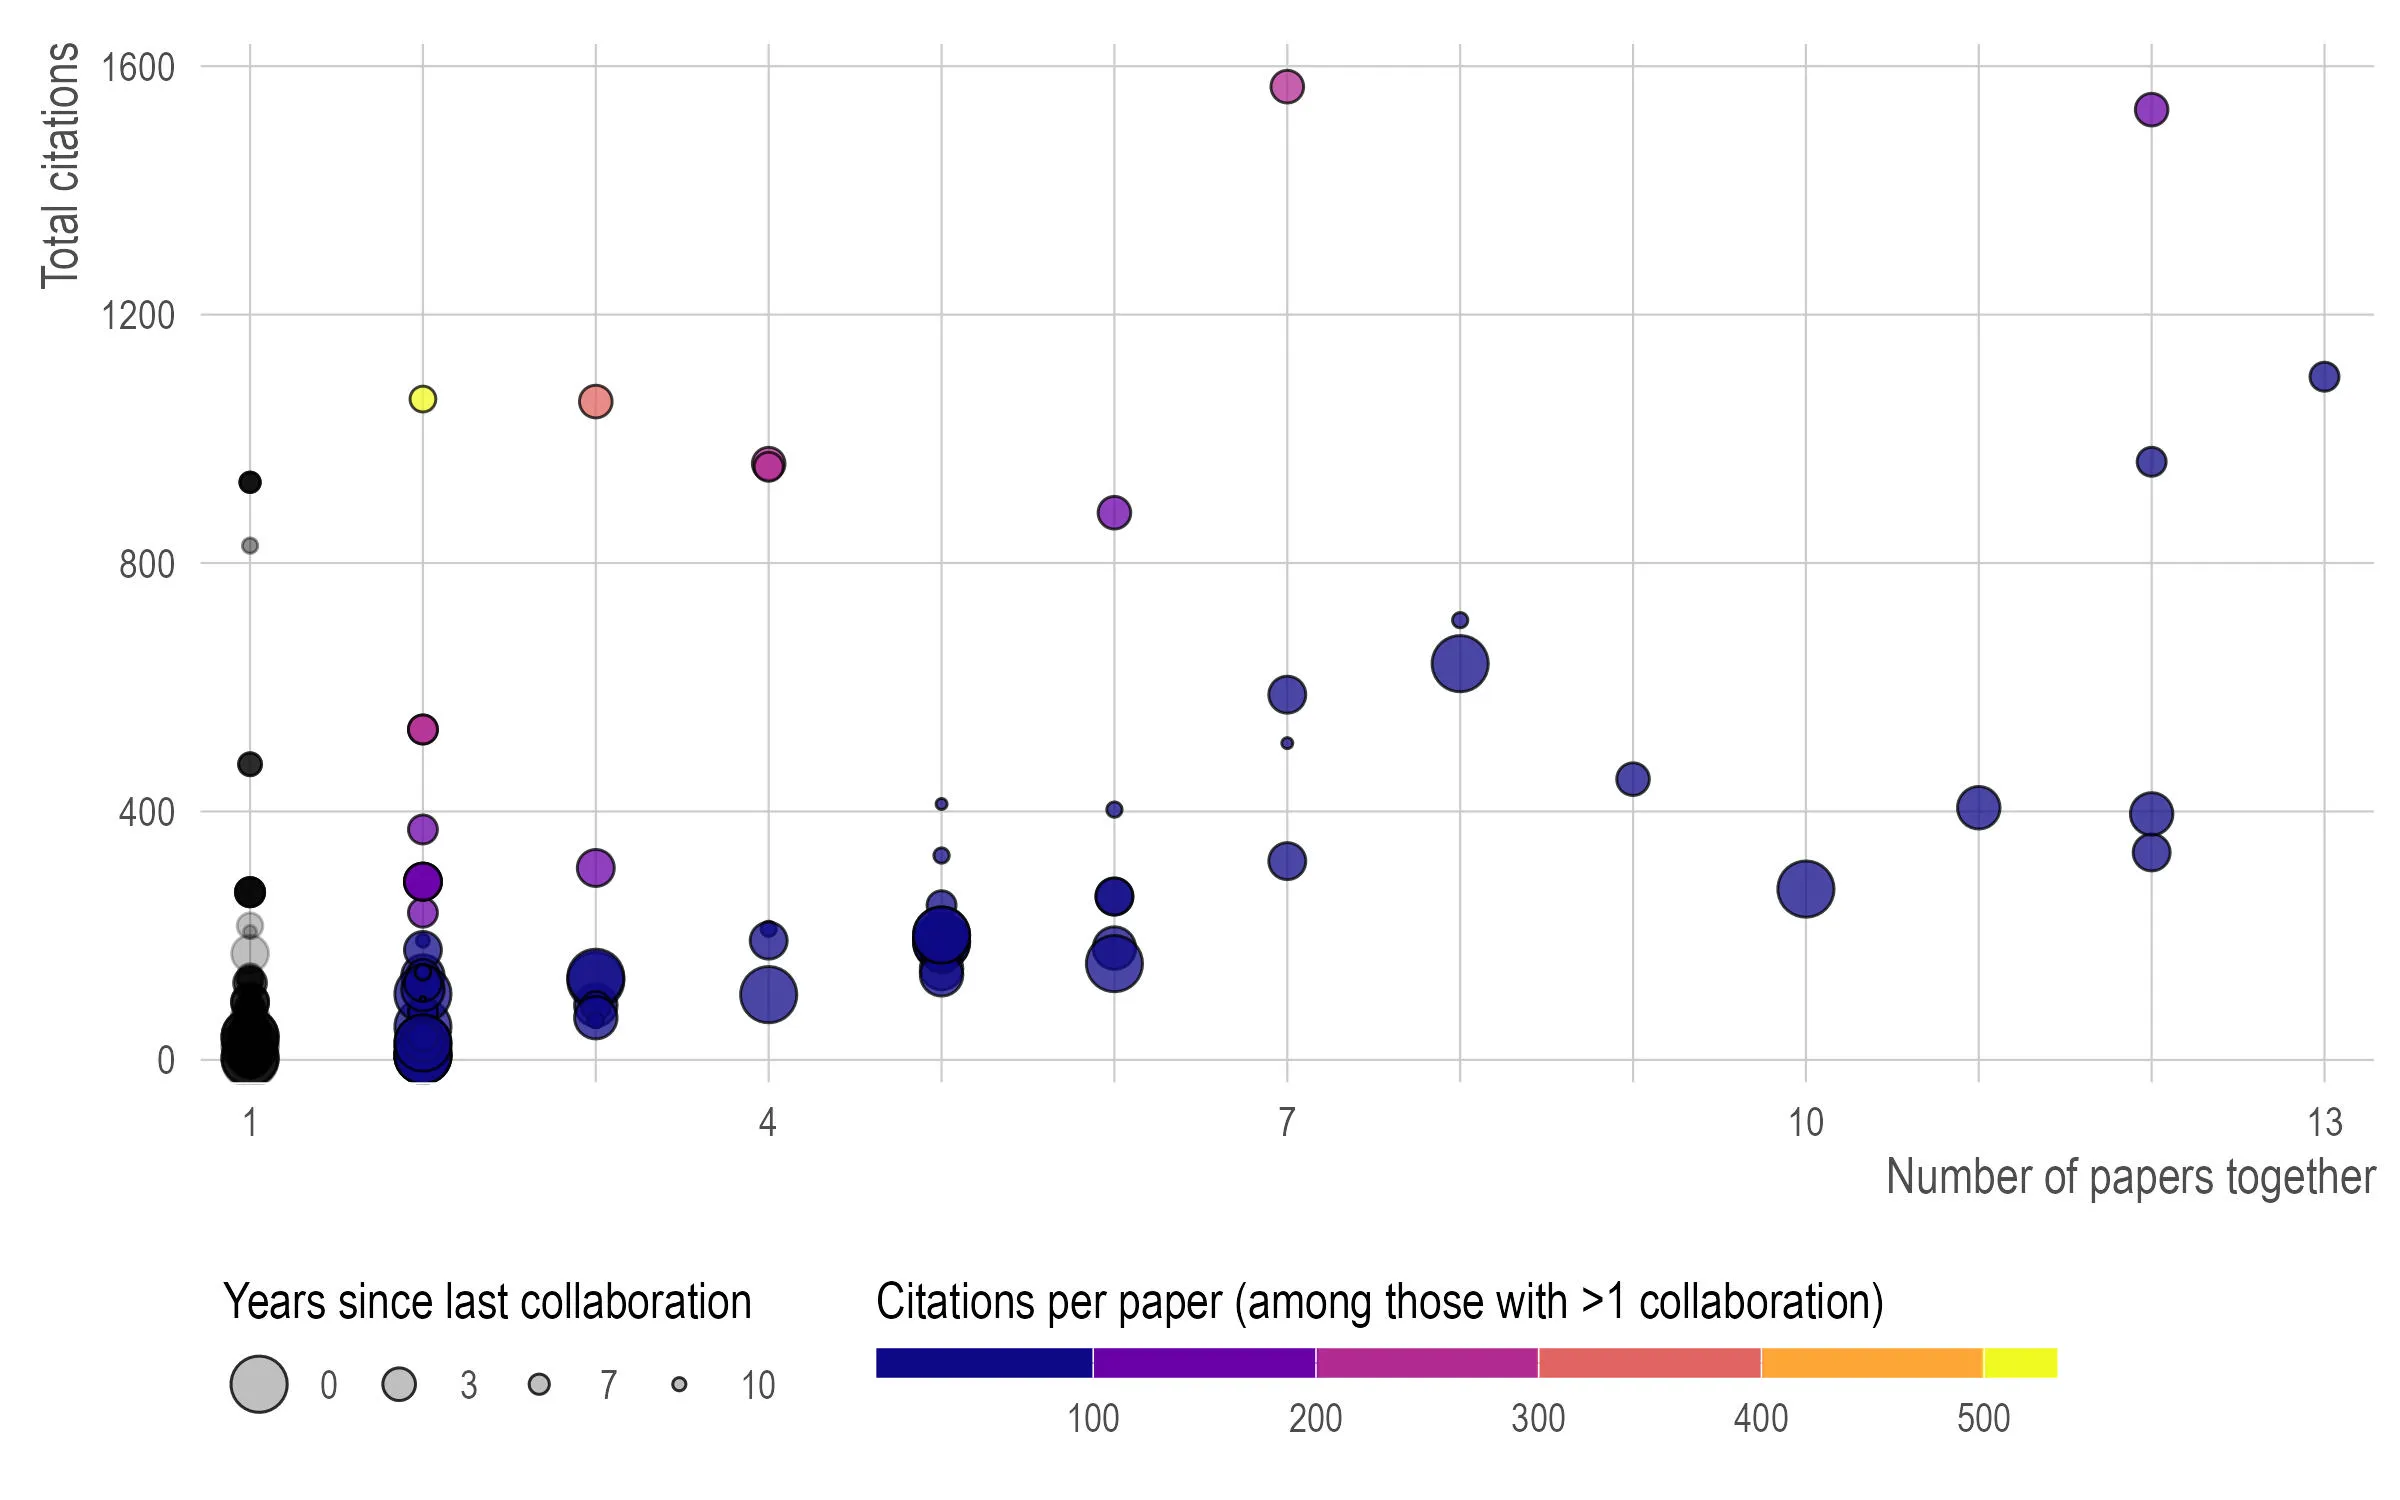
A scatter plot with number of papers together on the x-axis, 1 to 13, and total citations on the y-axis, 0 to about 1,570. Circle size is years since the last collaboration, larger meaning more recent, on a legend of 0, 3, 7 and 10. Colour is citations per paper among people with more than one collaboration, running dark blue below 100 through purple, magenta and orange to yellow above 500; people with a single collaboration are black or grey. The one yellow circle sits at two papers and about 1,070 citations, the highest citations per paper. The highest total, about 1,570, is at seven papers, with a second near 1,530 at twelve papers. Most points are dark blue, meaning under 100 citations per paper.