Student’s Tay Distribution
Taylor Swift has recorded 9 albums, each of them (except the most recent) has gone multi-platinum. In total, she has sold over 200 million records, won 10 Grammy’s, an Emmy, 32 AMA’s, and 23 Billboard Music Awards. Not bad for somebody who just turned 31.
This year, she’s managed to release two albums — they’re both very good. However, I noticed there seemed to be more profanity than I had remembered on her older albums. Here, I’ll use tidytext to see if she has actually increased her rate of profanity or if I’m simply misremembering things.
Descriptives
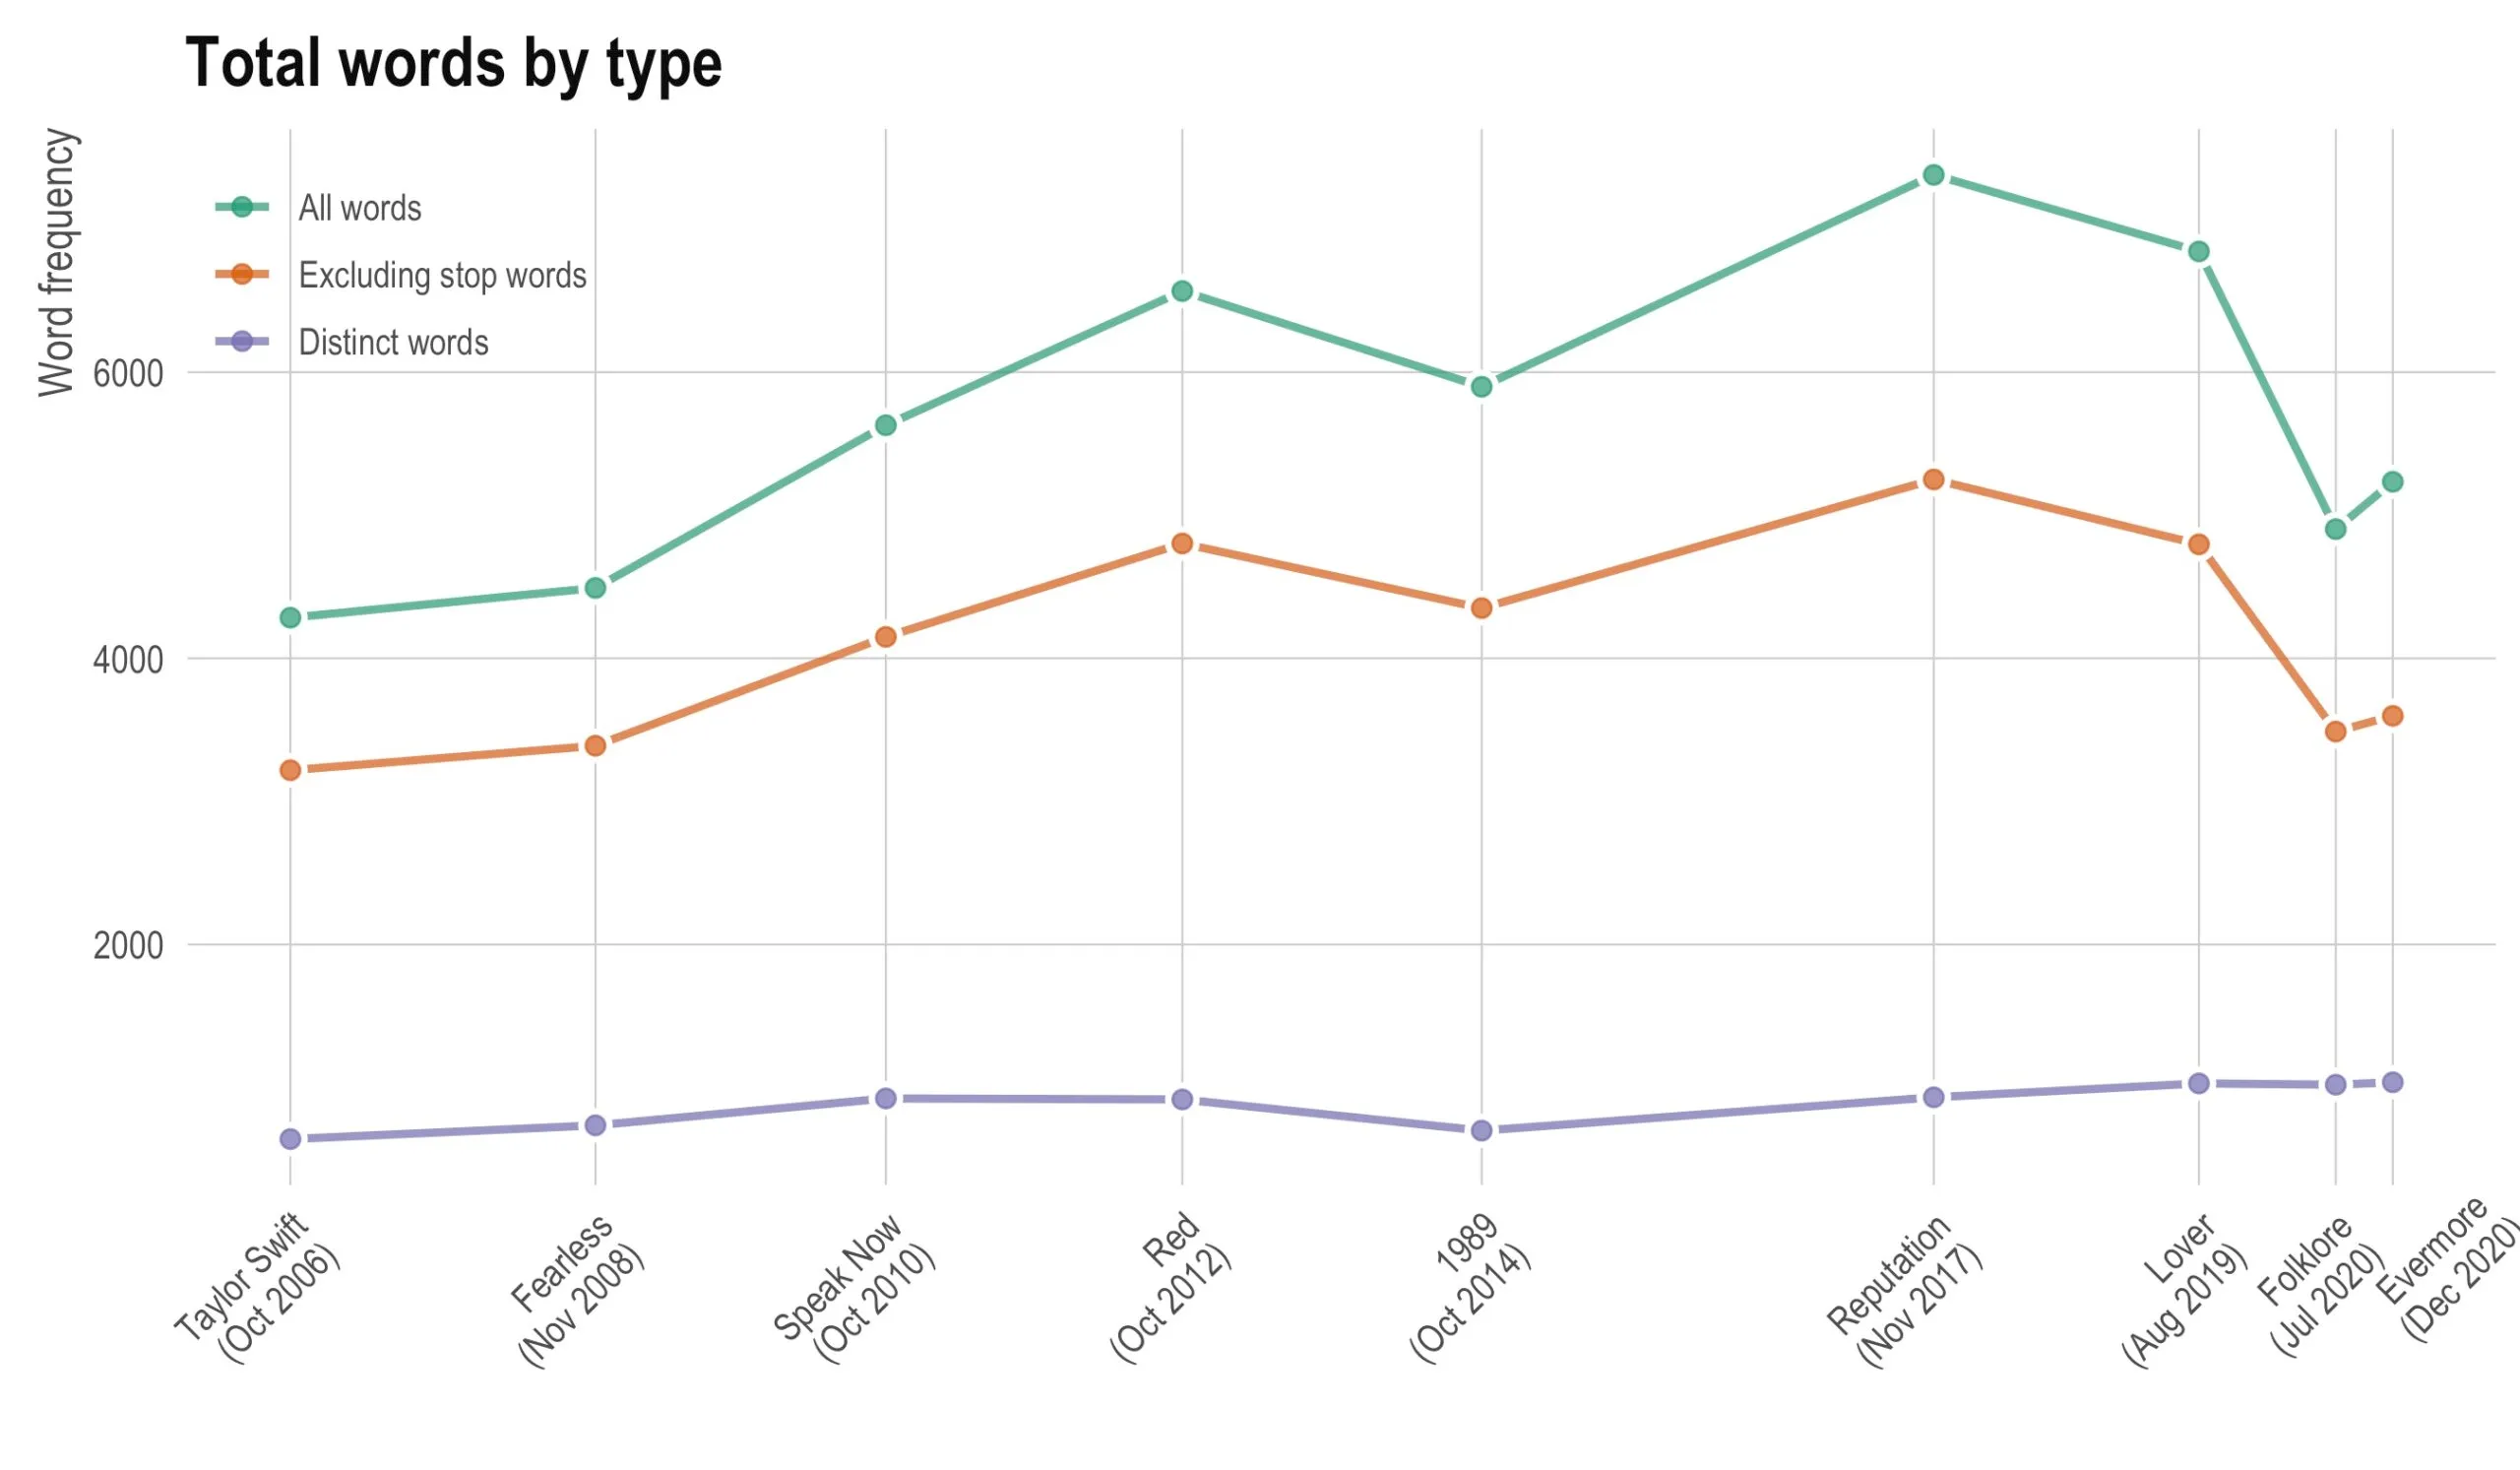
We’ll begin with some simple descriptives. How many words (y-axis) does each album (x-axis) have? Note, the x-axis uses albums as references but ticks are are spaced temporally. Below, we show all words (green) as well as after removing stop words (orange) and counting only distinct words (purple). It appears like the number of distinct words has more or less stayed the same throughout the discography while the number of total words increased a bit and then decreased.
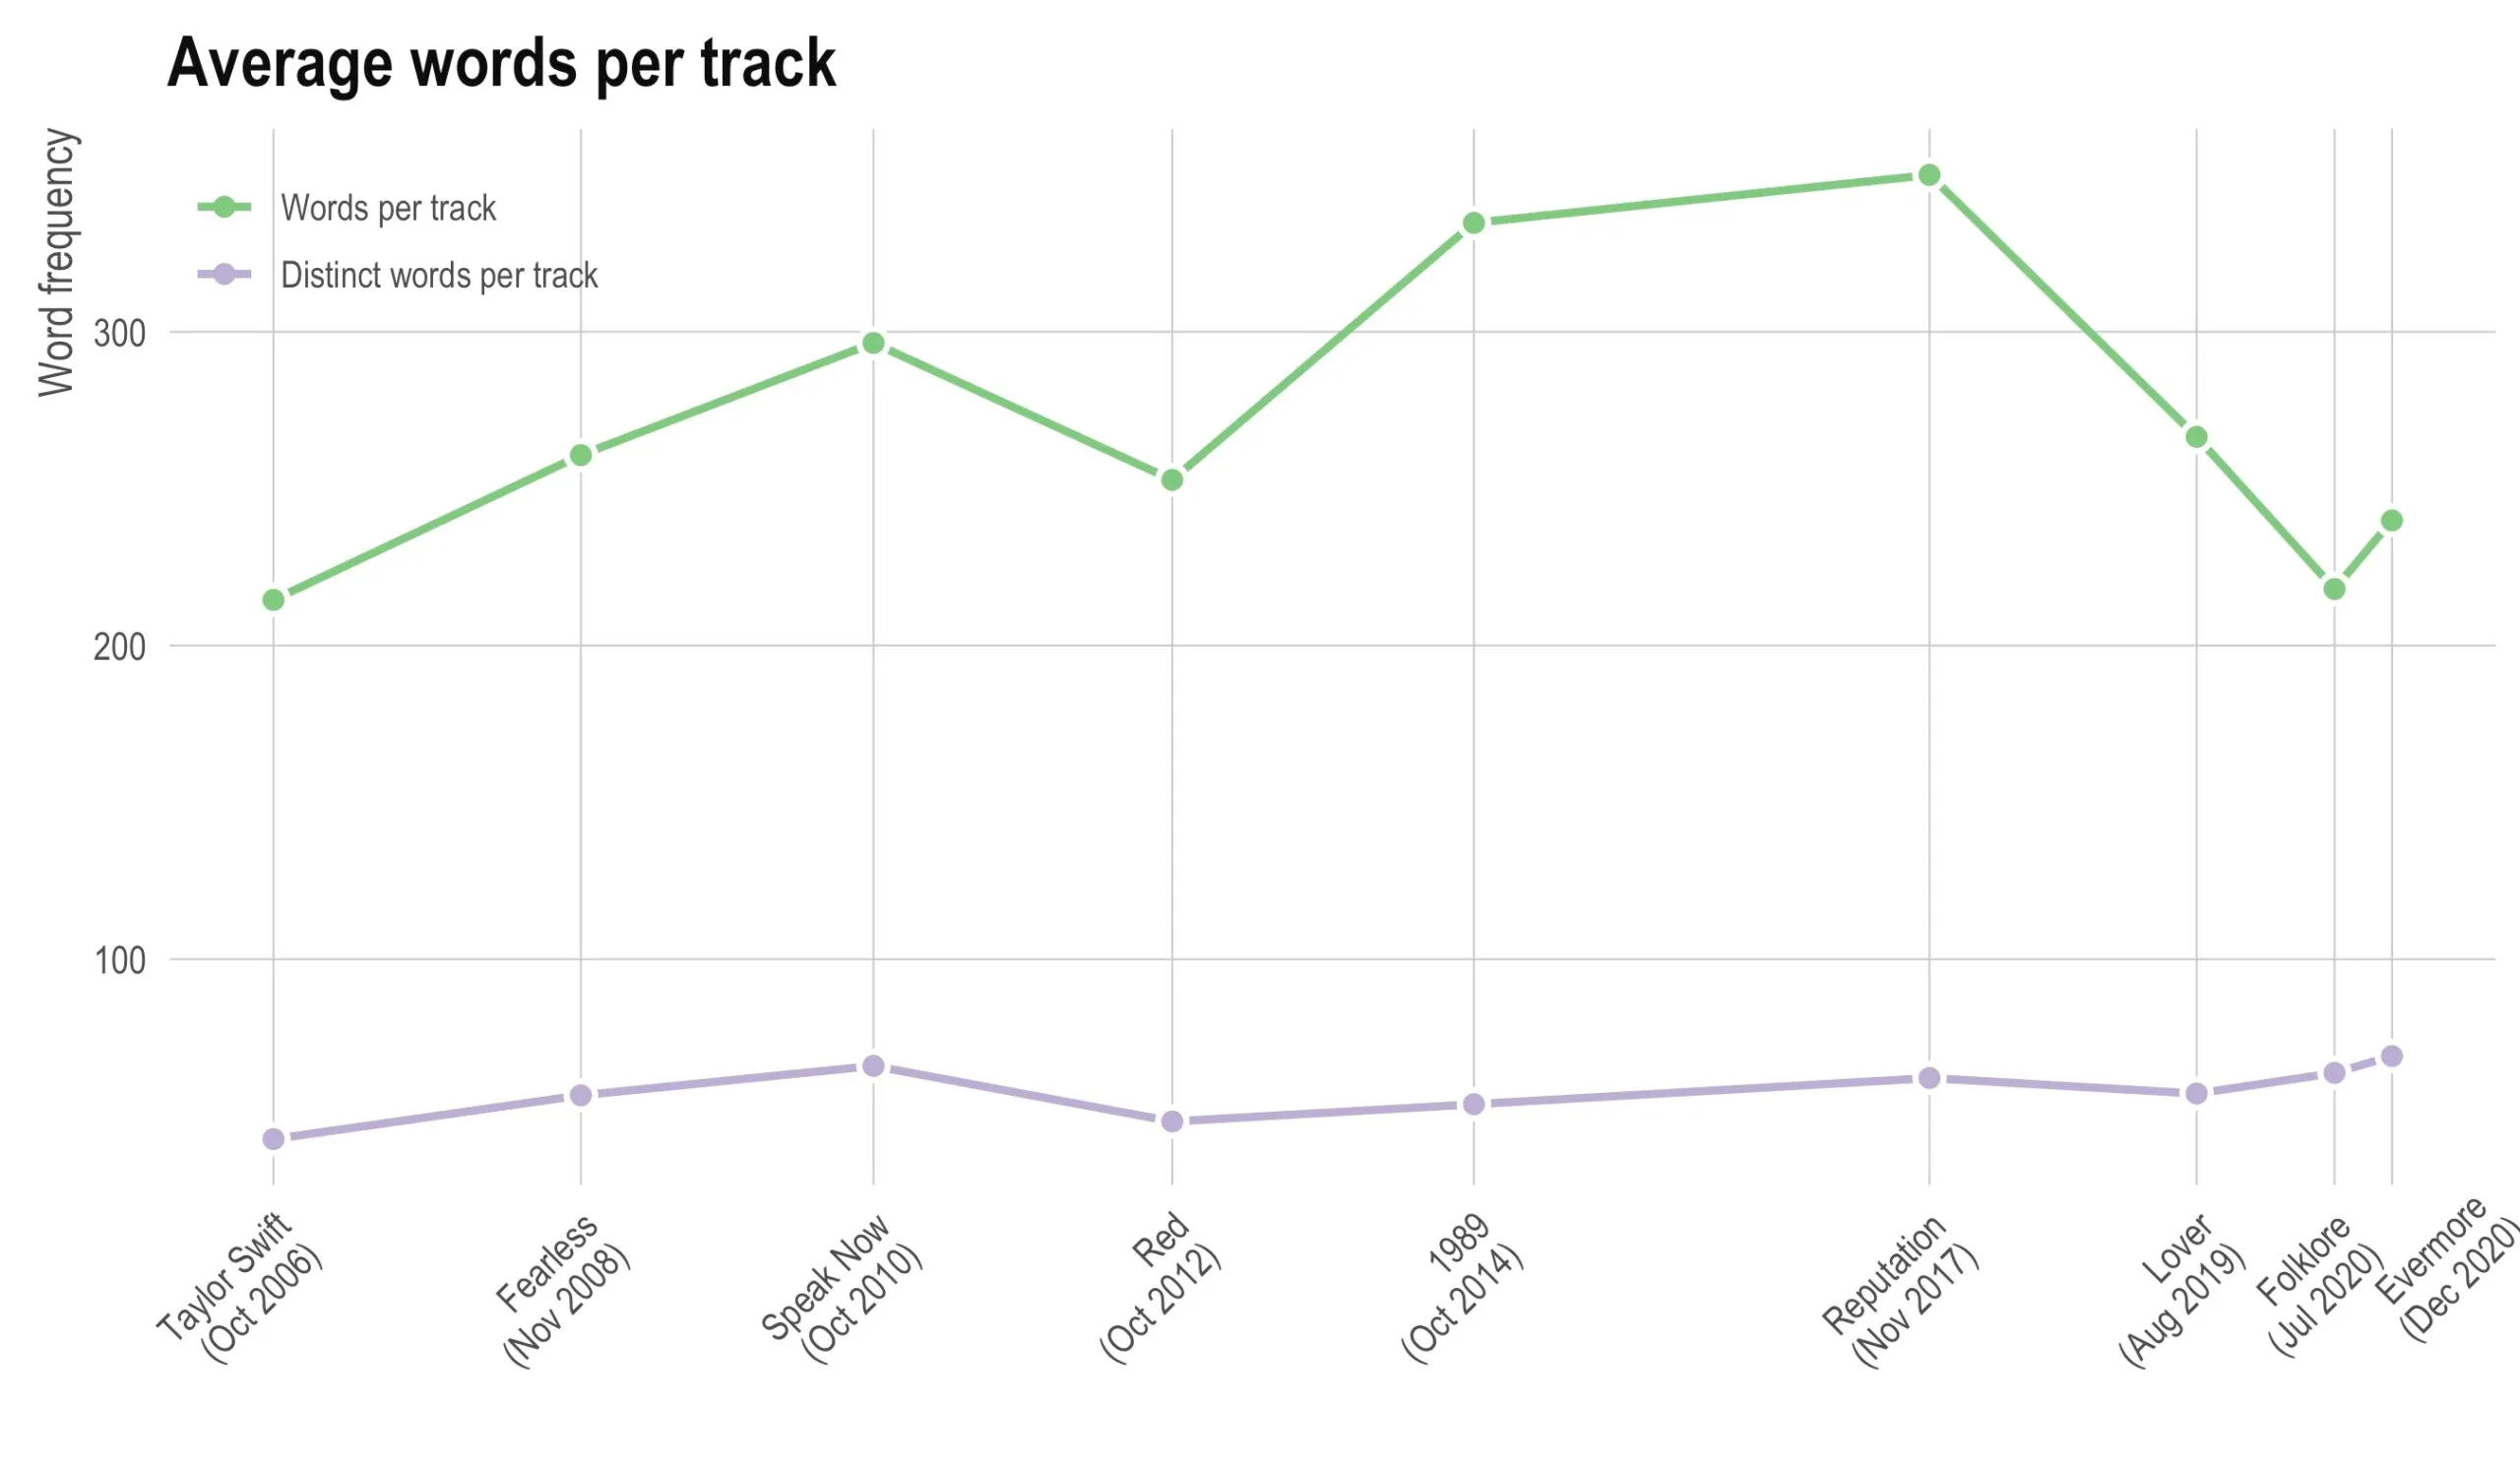
Perhaps this increase in the middle is explained to having more tracks on each album? Below we plot the average number of words per track (green) and the average number of distinct words per track (purple). Between the two plots, I think a likely explanation for the increase in words in the middle albums is due to more repetition and not due to more tracks.
Sentiment
How has sentiment changed over time? That is, have albums gotten more or less sad or happy? Is there a pattern such that the albums get more (or less) happy (or sad) as the album progresses? Below, I plot the average sentiment (y-axis) for each track (x-axis) by album (facets). The lines are fitted generalized additive models.
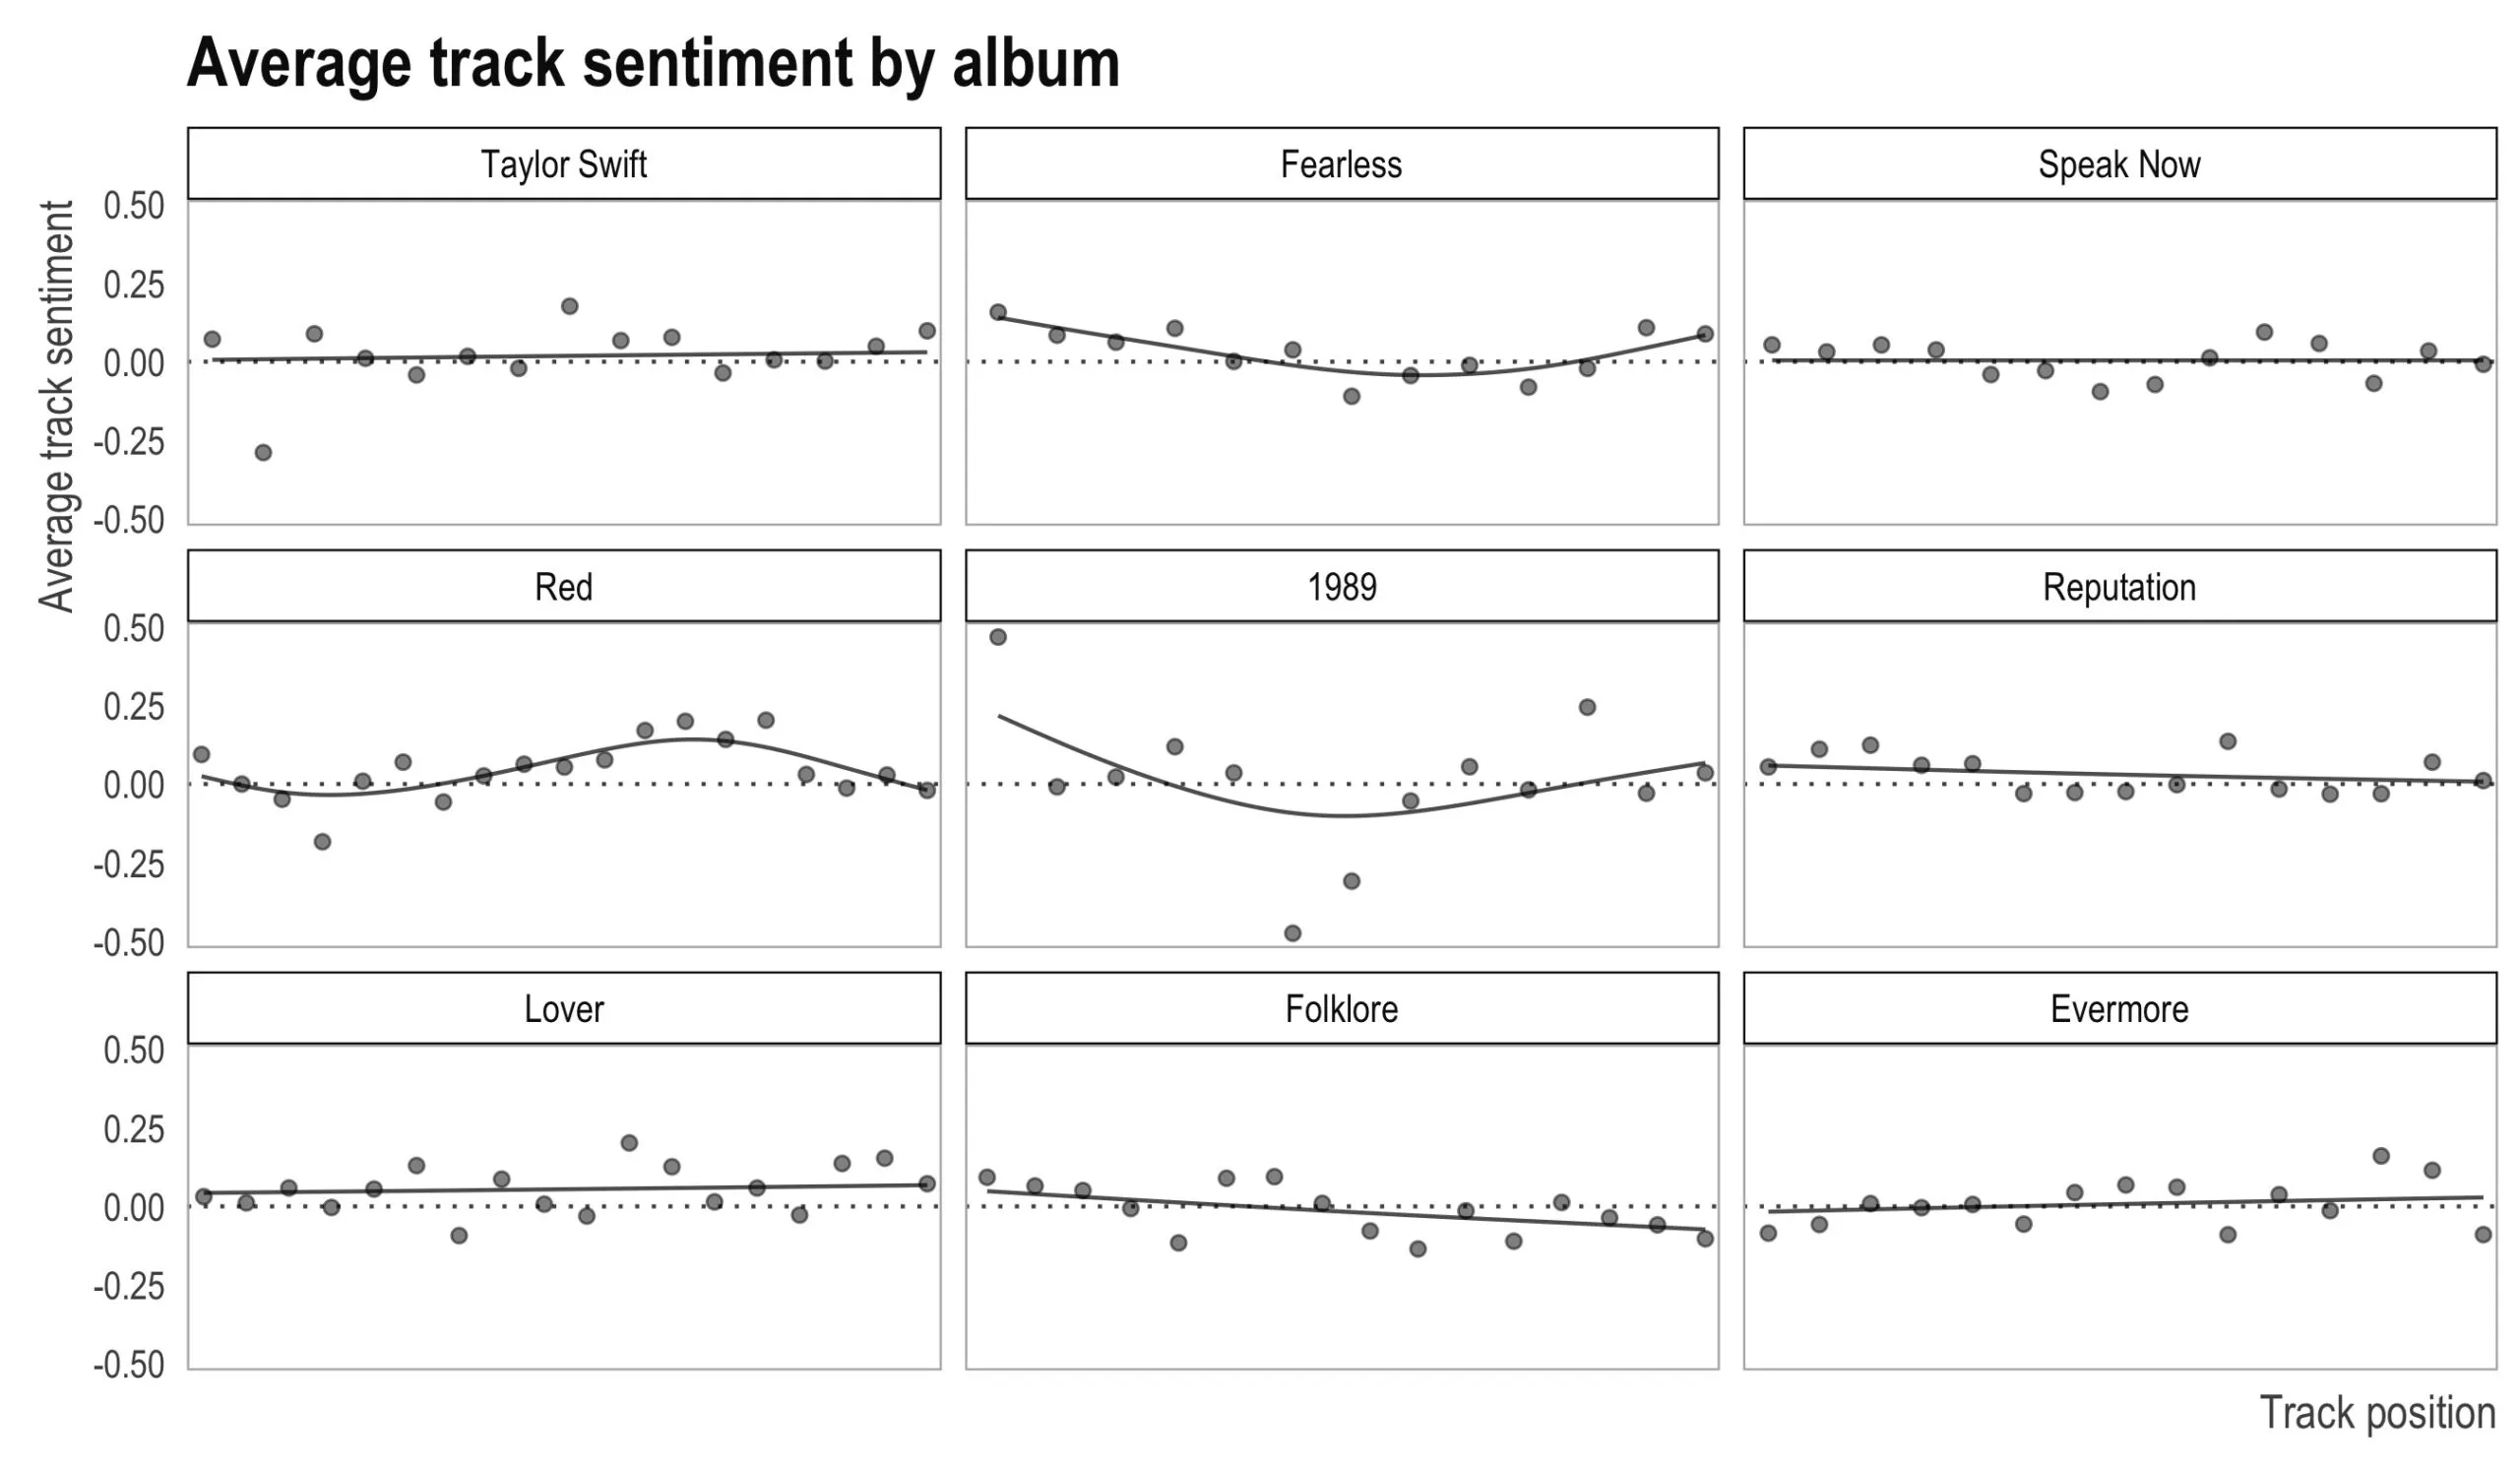
The sentiment across albums appears more or less flat (i.e., tracks do not get more or less positive as the album progresses). The exception is 1989, where the first track is “Welcome to New York” and “welcome” is classified as “positive”. In addition, the sixth track is “Shake it off” and “hater” (repeated in the chorus) is classified as “negative”. Excluding these two tracks results in a flat line.
Given there appears to be no relationship with average sentiment and track position, maybe albums themselves (across all lyrics and tracks) have different distributions of sentiment? Below is the density of sentiment for individual lyrics (i.e., lines) by album.
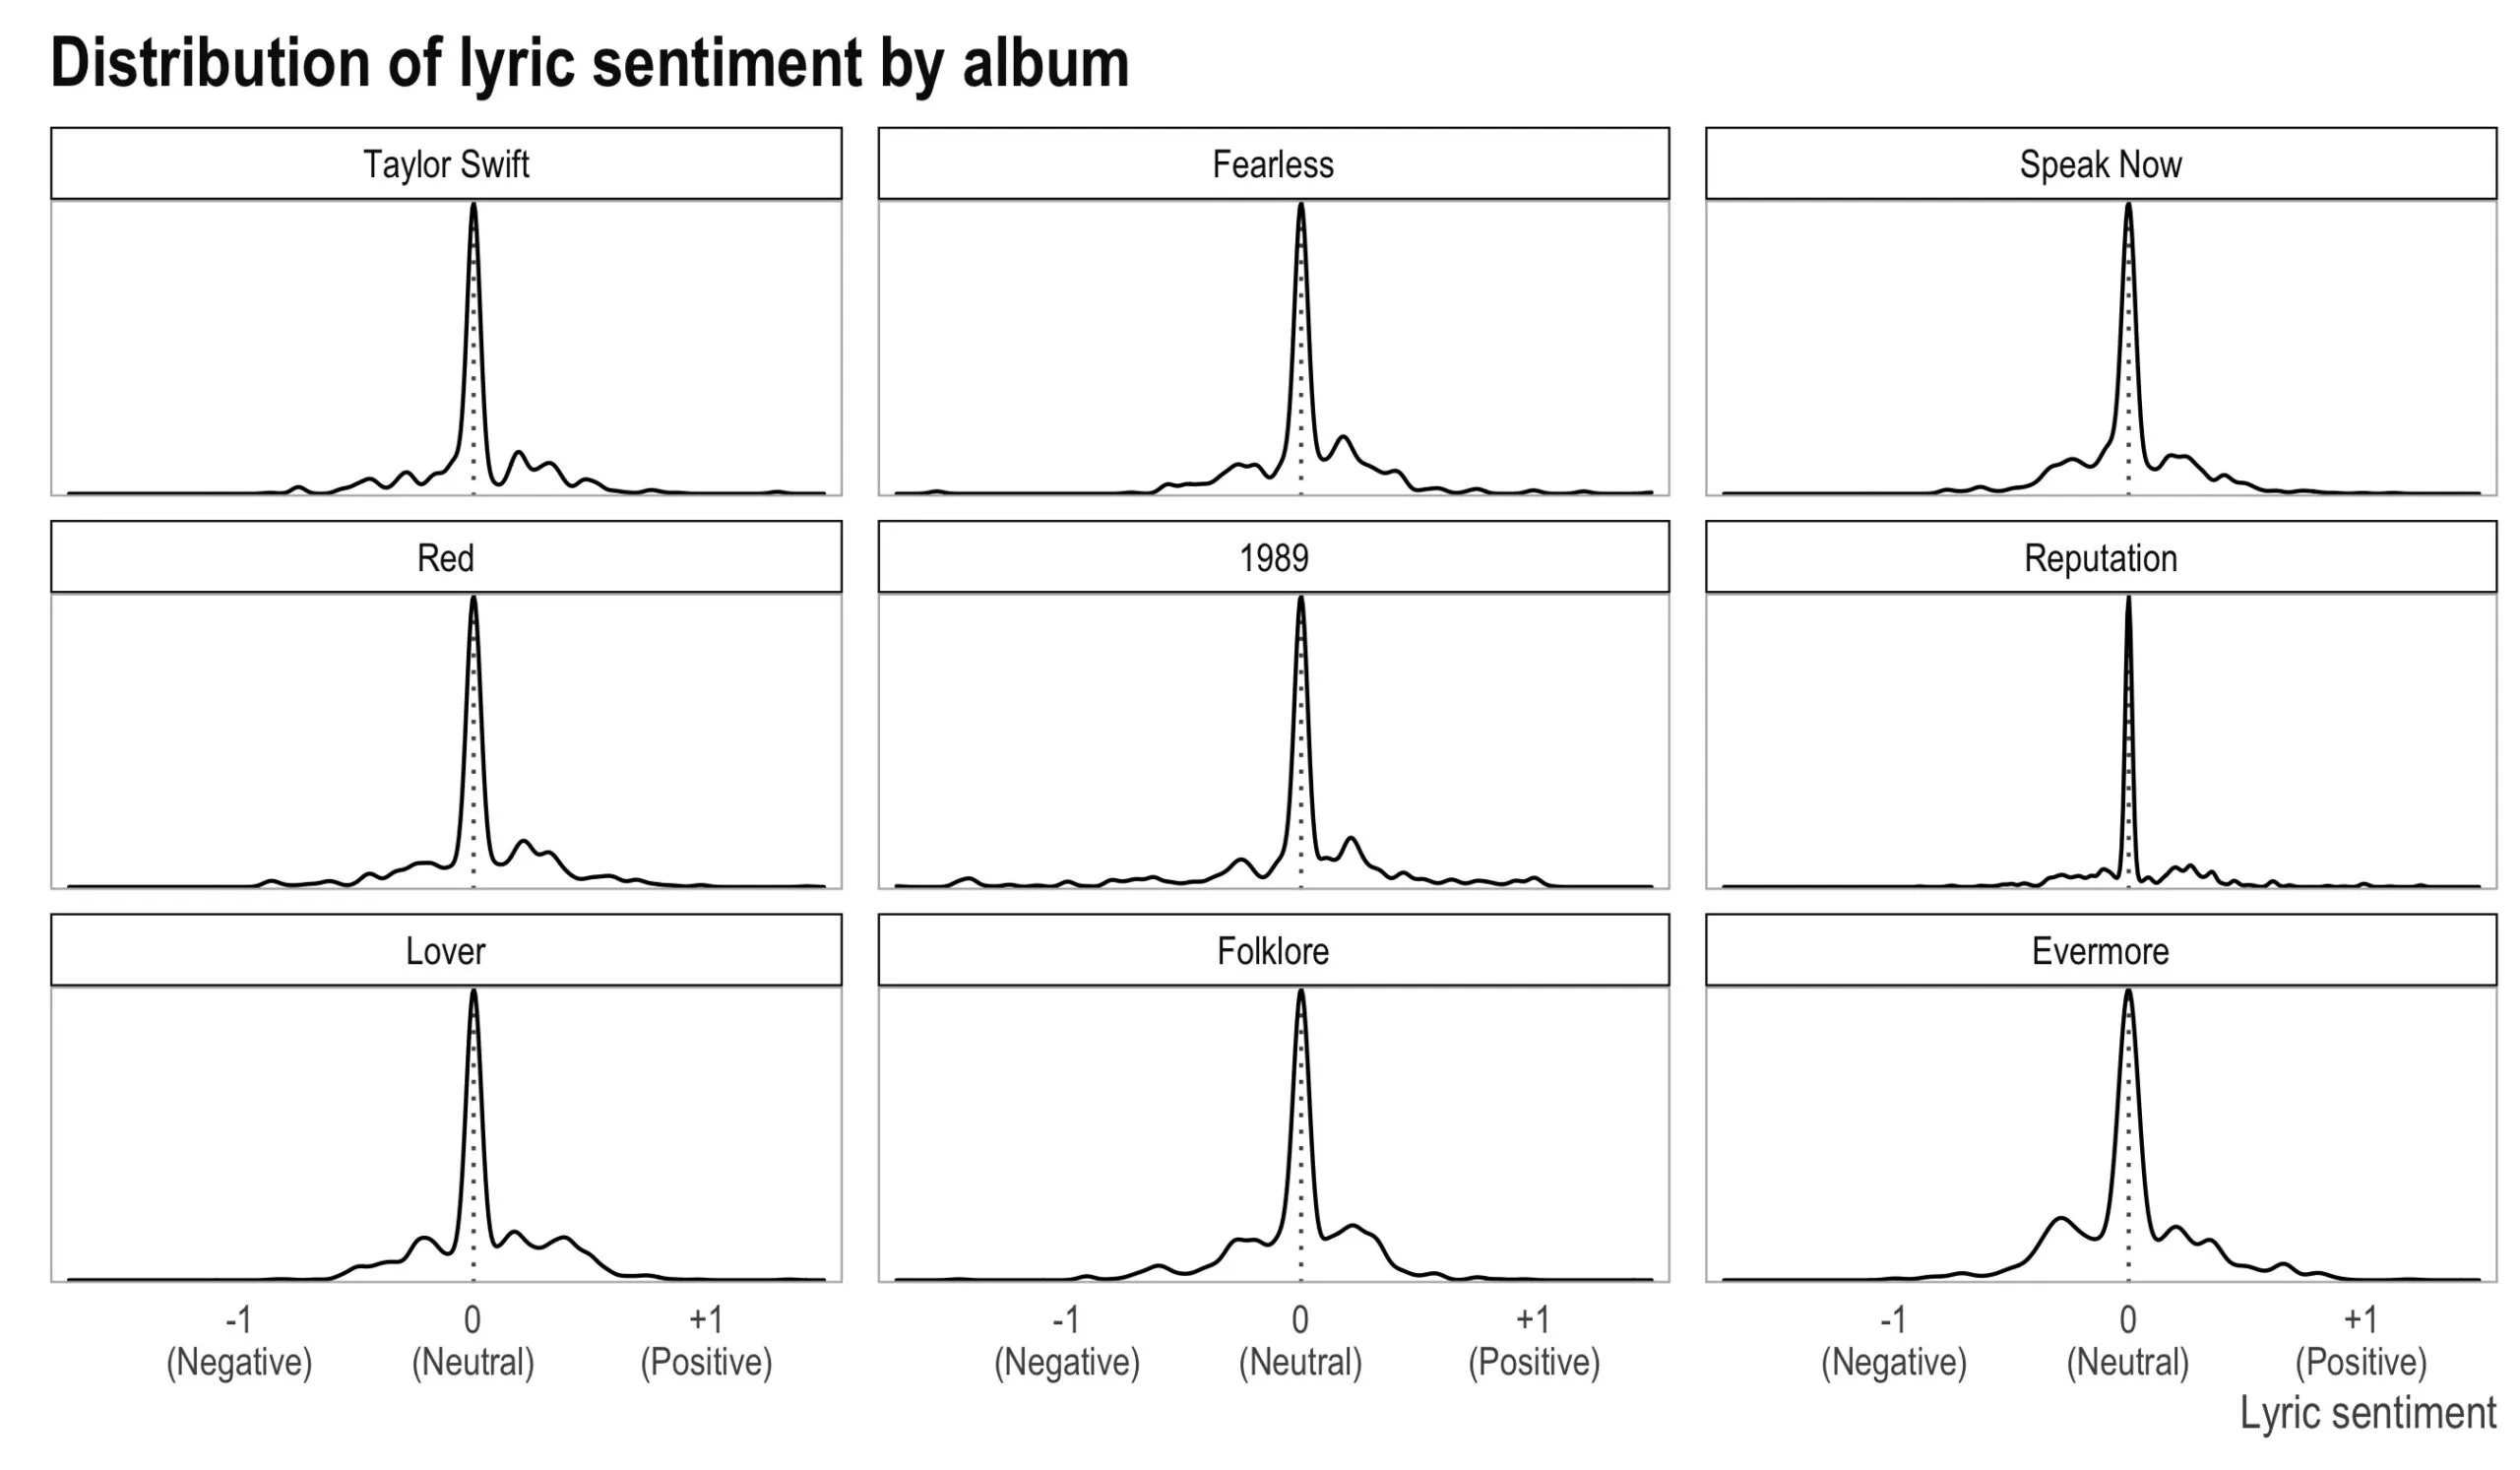
Most lyrics (in all albums) are fairly neutral. Reputation is especially pointy (yes, that’s the statistical term), but the last three albums have a bit more mass on both sides of 0 than previous albums.
Profanity
Ok. So now the main question. Has profanity increased over time? Below is the rate of profanity per 1,000 words (y-axis) over time/album (x-axis) by word (colors).
![A line chart titled Taylor Swift's Profanity Rate, 2006 to 2020, over the same nine albums from Taylor Swift (Oct 2006) to Evermore (Dec 2020). The y-axis is profanity rate as curse words per 1,000 words after removing stop words, 0 to about 7. Five lines, one per word, censored as they appear on the chart: bitch in red, [god]damn in blue, f*ck[ed] in green, hell in purple and sh*t in orange. All five sit at or near zero through the first three albums, apart from a single blue point at about 1.9 on the 2006 debut. From Red onward small rises appear, none above about 1.4 until Folklore. On the last two albums every line jumps: blue reaches about 6.8, orange about 3.0 and green about 1.3 — far above anything earlier. A footnote reads: after removing stop words.](/_astro/p5_cursing_over_time-1-scaled.CMJMLrRq_Z2Qv1O.webp)
Yes, there’s more profanity in the recent albums than in the older albums. Maybe 2020 is getting to TSwift too? Check out Folklore and Evermore if you haven’t already.
(Code is here.)