
Catching up + Collaboration network update: 2010-2024
You wouldn’t know it from the lack of updates on this blog, but it’s been a busy couple years. I’m sure I’m missing many important things, but a few highlights include:
- Ben’s JAMA Peds paper got a lot of media attention, which prompted action from Senators Duckworth and Durbin.
- A student paper on sub-national excess overdose estimates got published in AJPH after four years — just proving how resilient and persistent the new crop of PhD students are.
- Keith and I wrote a thing about how the “higher” or “lower” mortality really depends on your comparison group.
- Our JAMA paper estimating parental deaths due to drug poisoning and firearms was cited in the US Surgeon General’s Advisory on Firearm Violence, which was deleted (today) by the current administration. Thankfully, I’m vain and saved a copy of the PDF, which you can find here.
- Monica and I wrote a thing about how we need better data to understand drug use — especially timely as public health data get removed, discontinued, or paused.
- A paper with Holly (that went through at least 8 rejections) was finally accepted, wrapping up a 3 year long project.
- After a couple dozen meetings, a dozen or so flights, and 2.5 years of work, the NASEM Consensus Committee report I was working on is finally out.
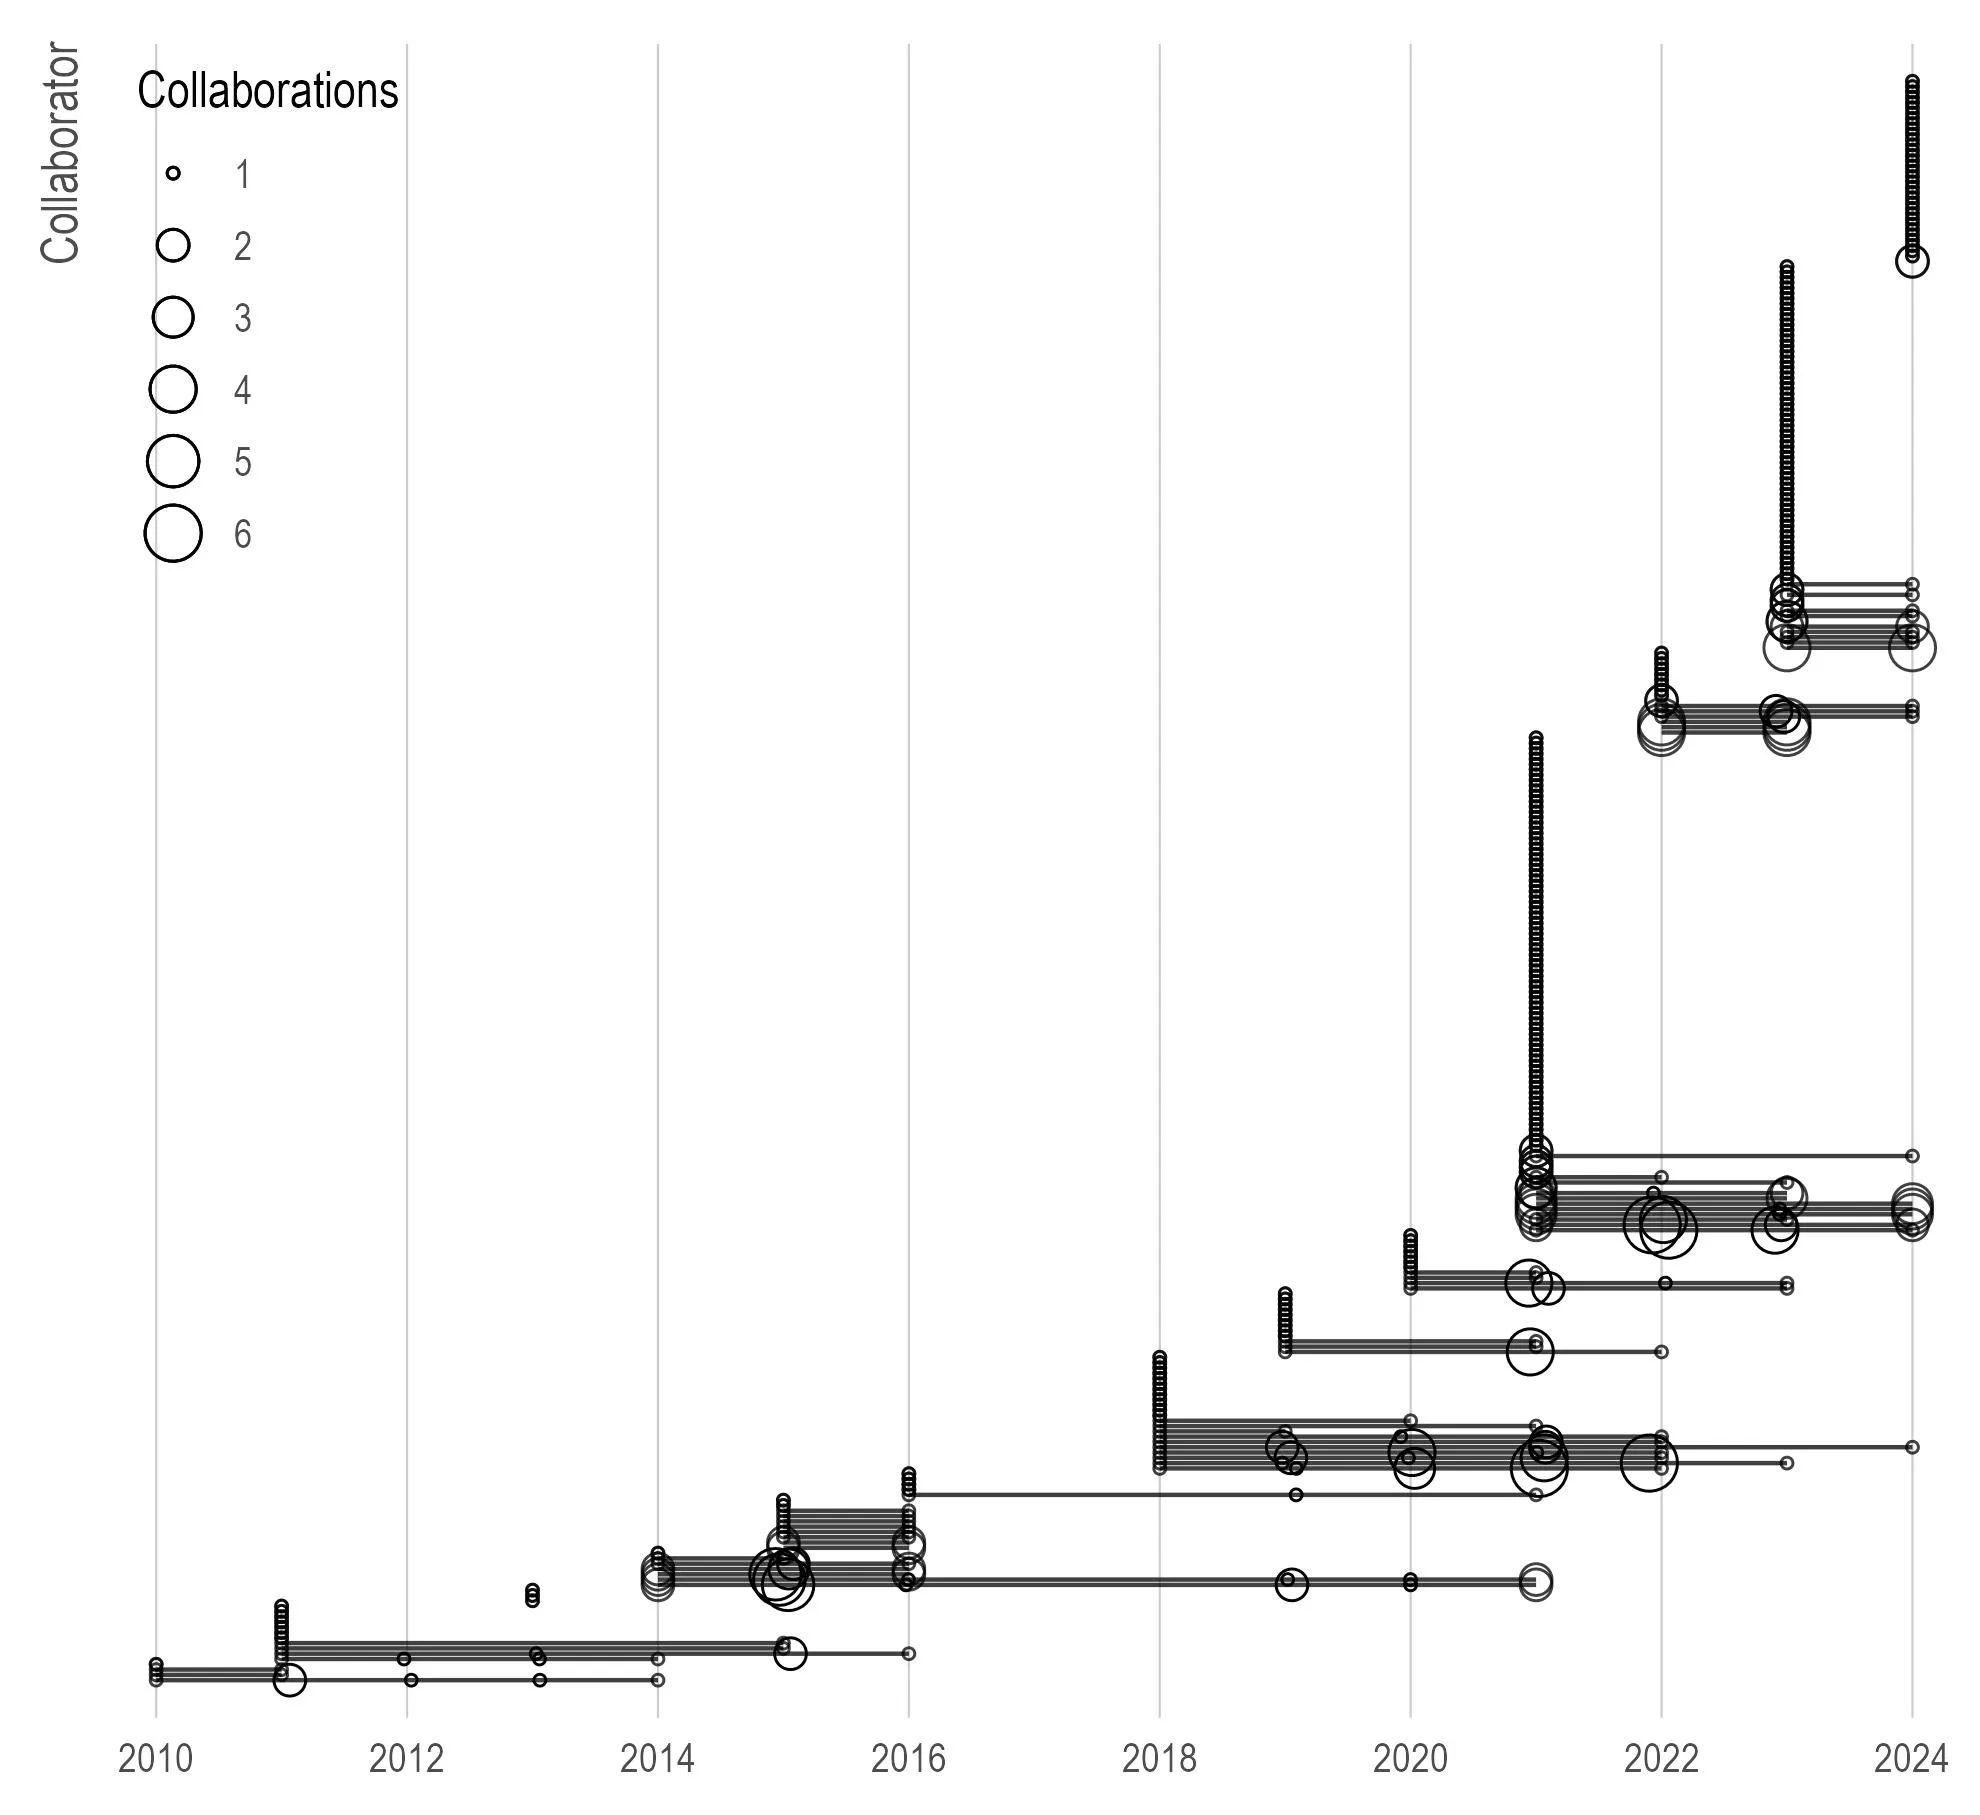
Below is a plot of collaborations/papers (circles) over time (x-axis) by collaborator/coauthor (y-axis). I always like this plot because I feel like it is both a useful reminder that really good, compatible collaborators (i.e., the ones you want to work with again and again) are rare, but also that some one-off projects were fun and you got to meet interesting people and that made the whole thing worth it.
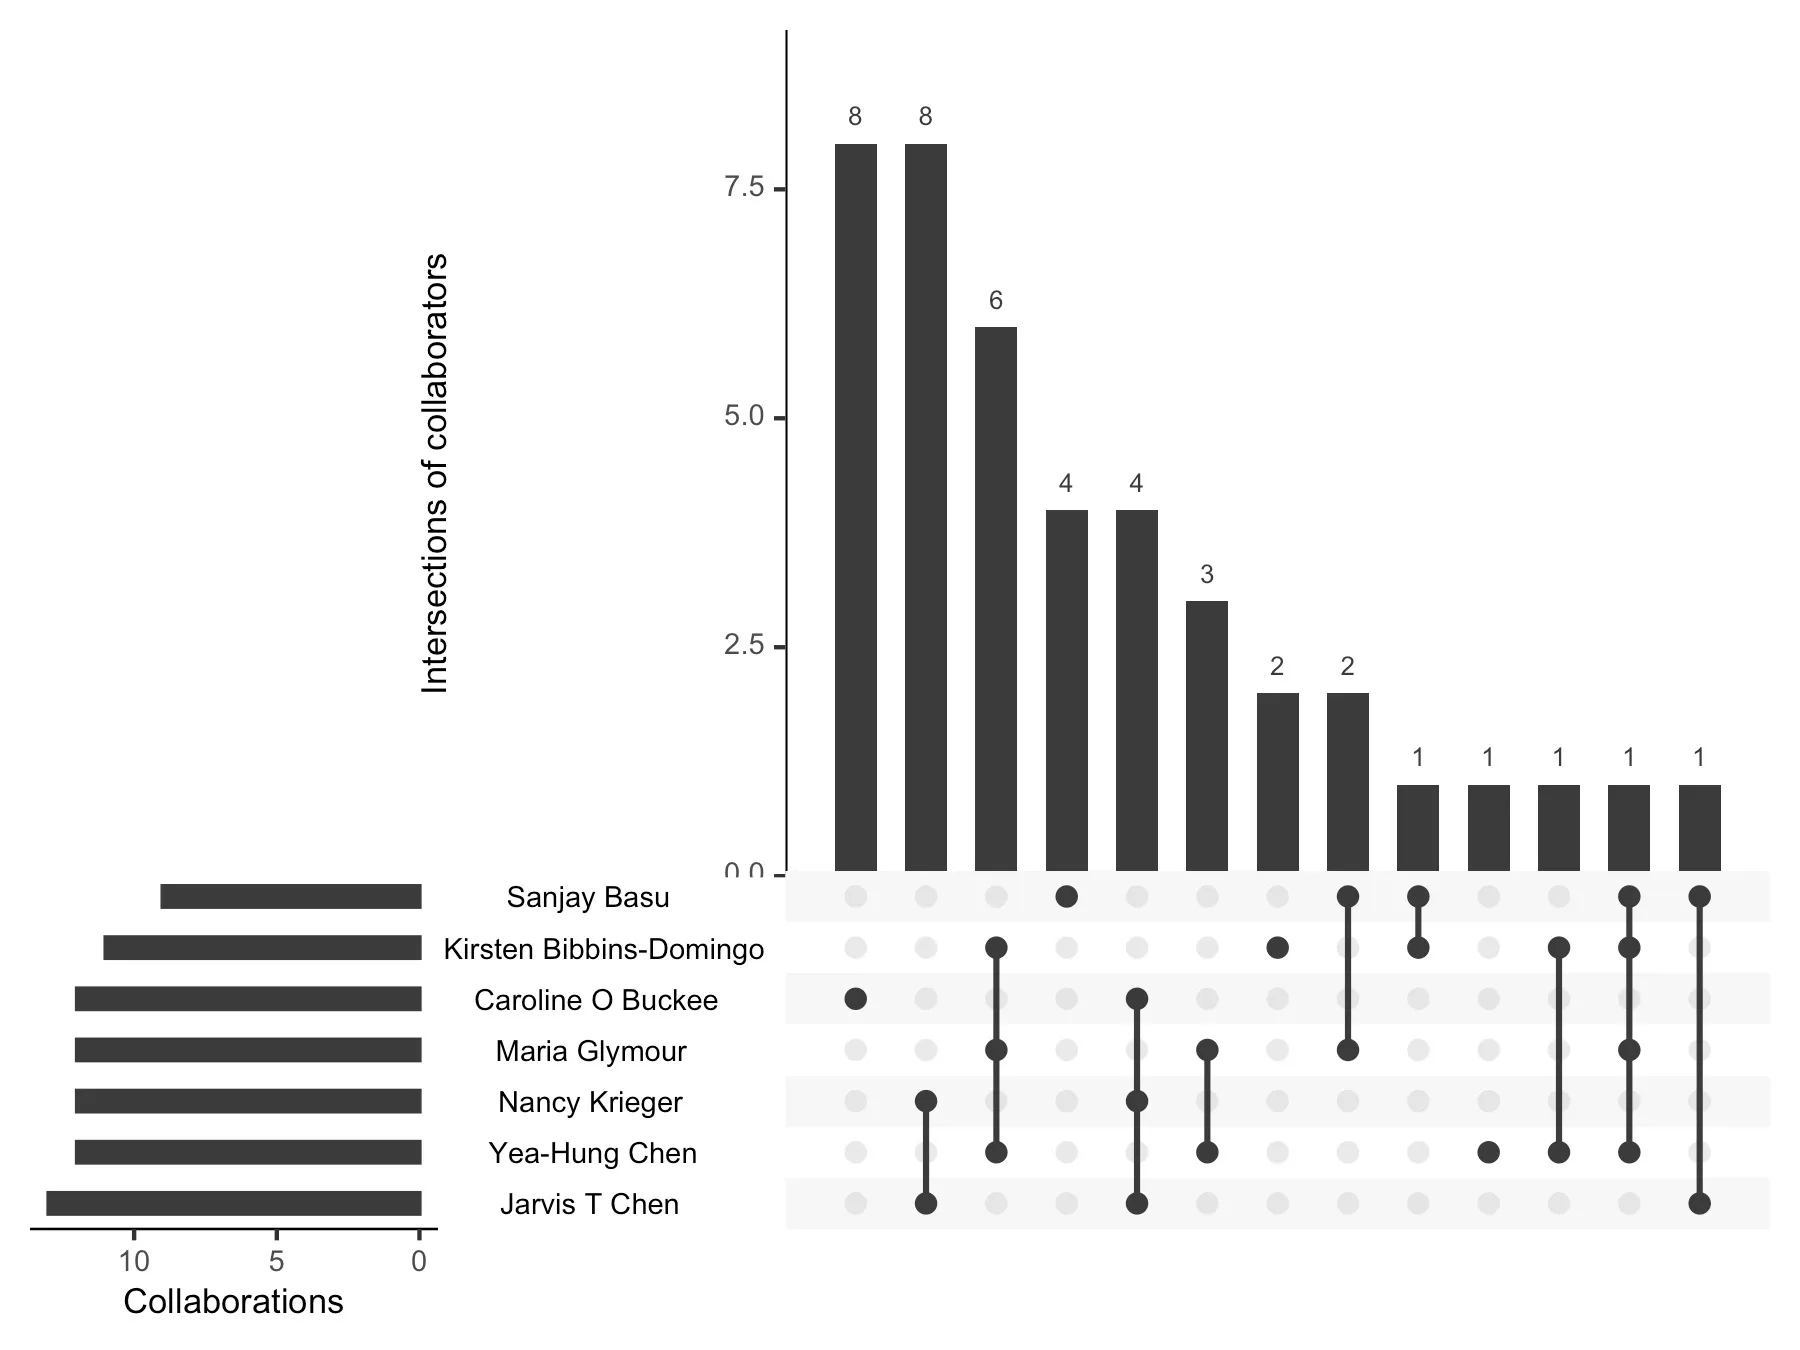
Here is an upset plot of my most frequent collaborators (in terms of numbers of papers) and their different sets. Most of these collaborators are actually people I don’t often collaborate with anymore, but when we did collaborate, we were quite productive.
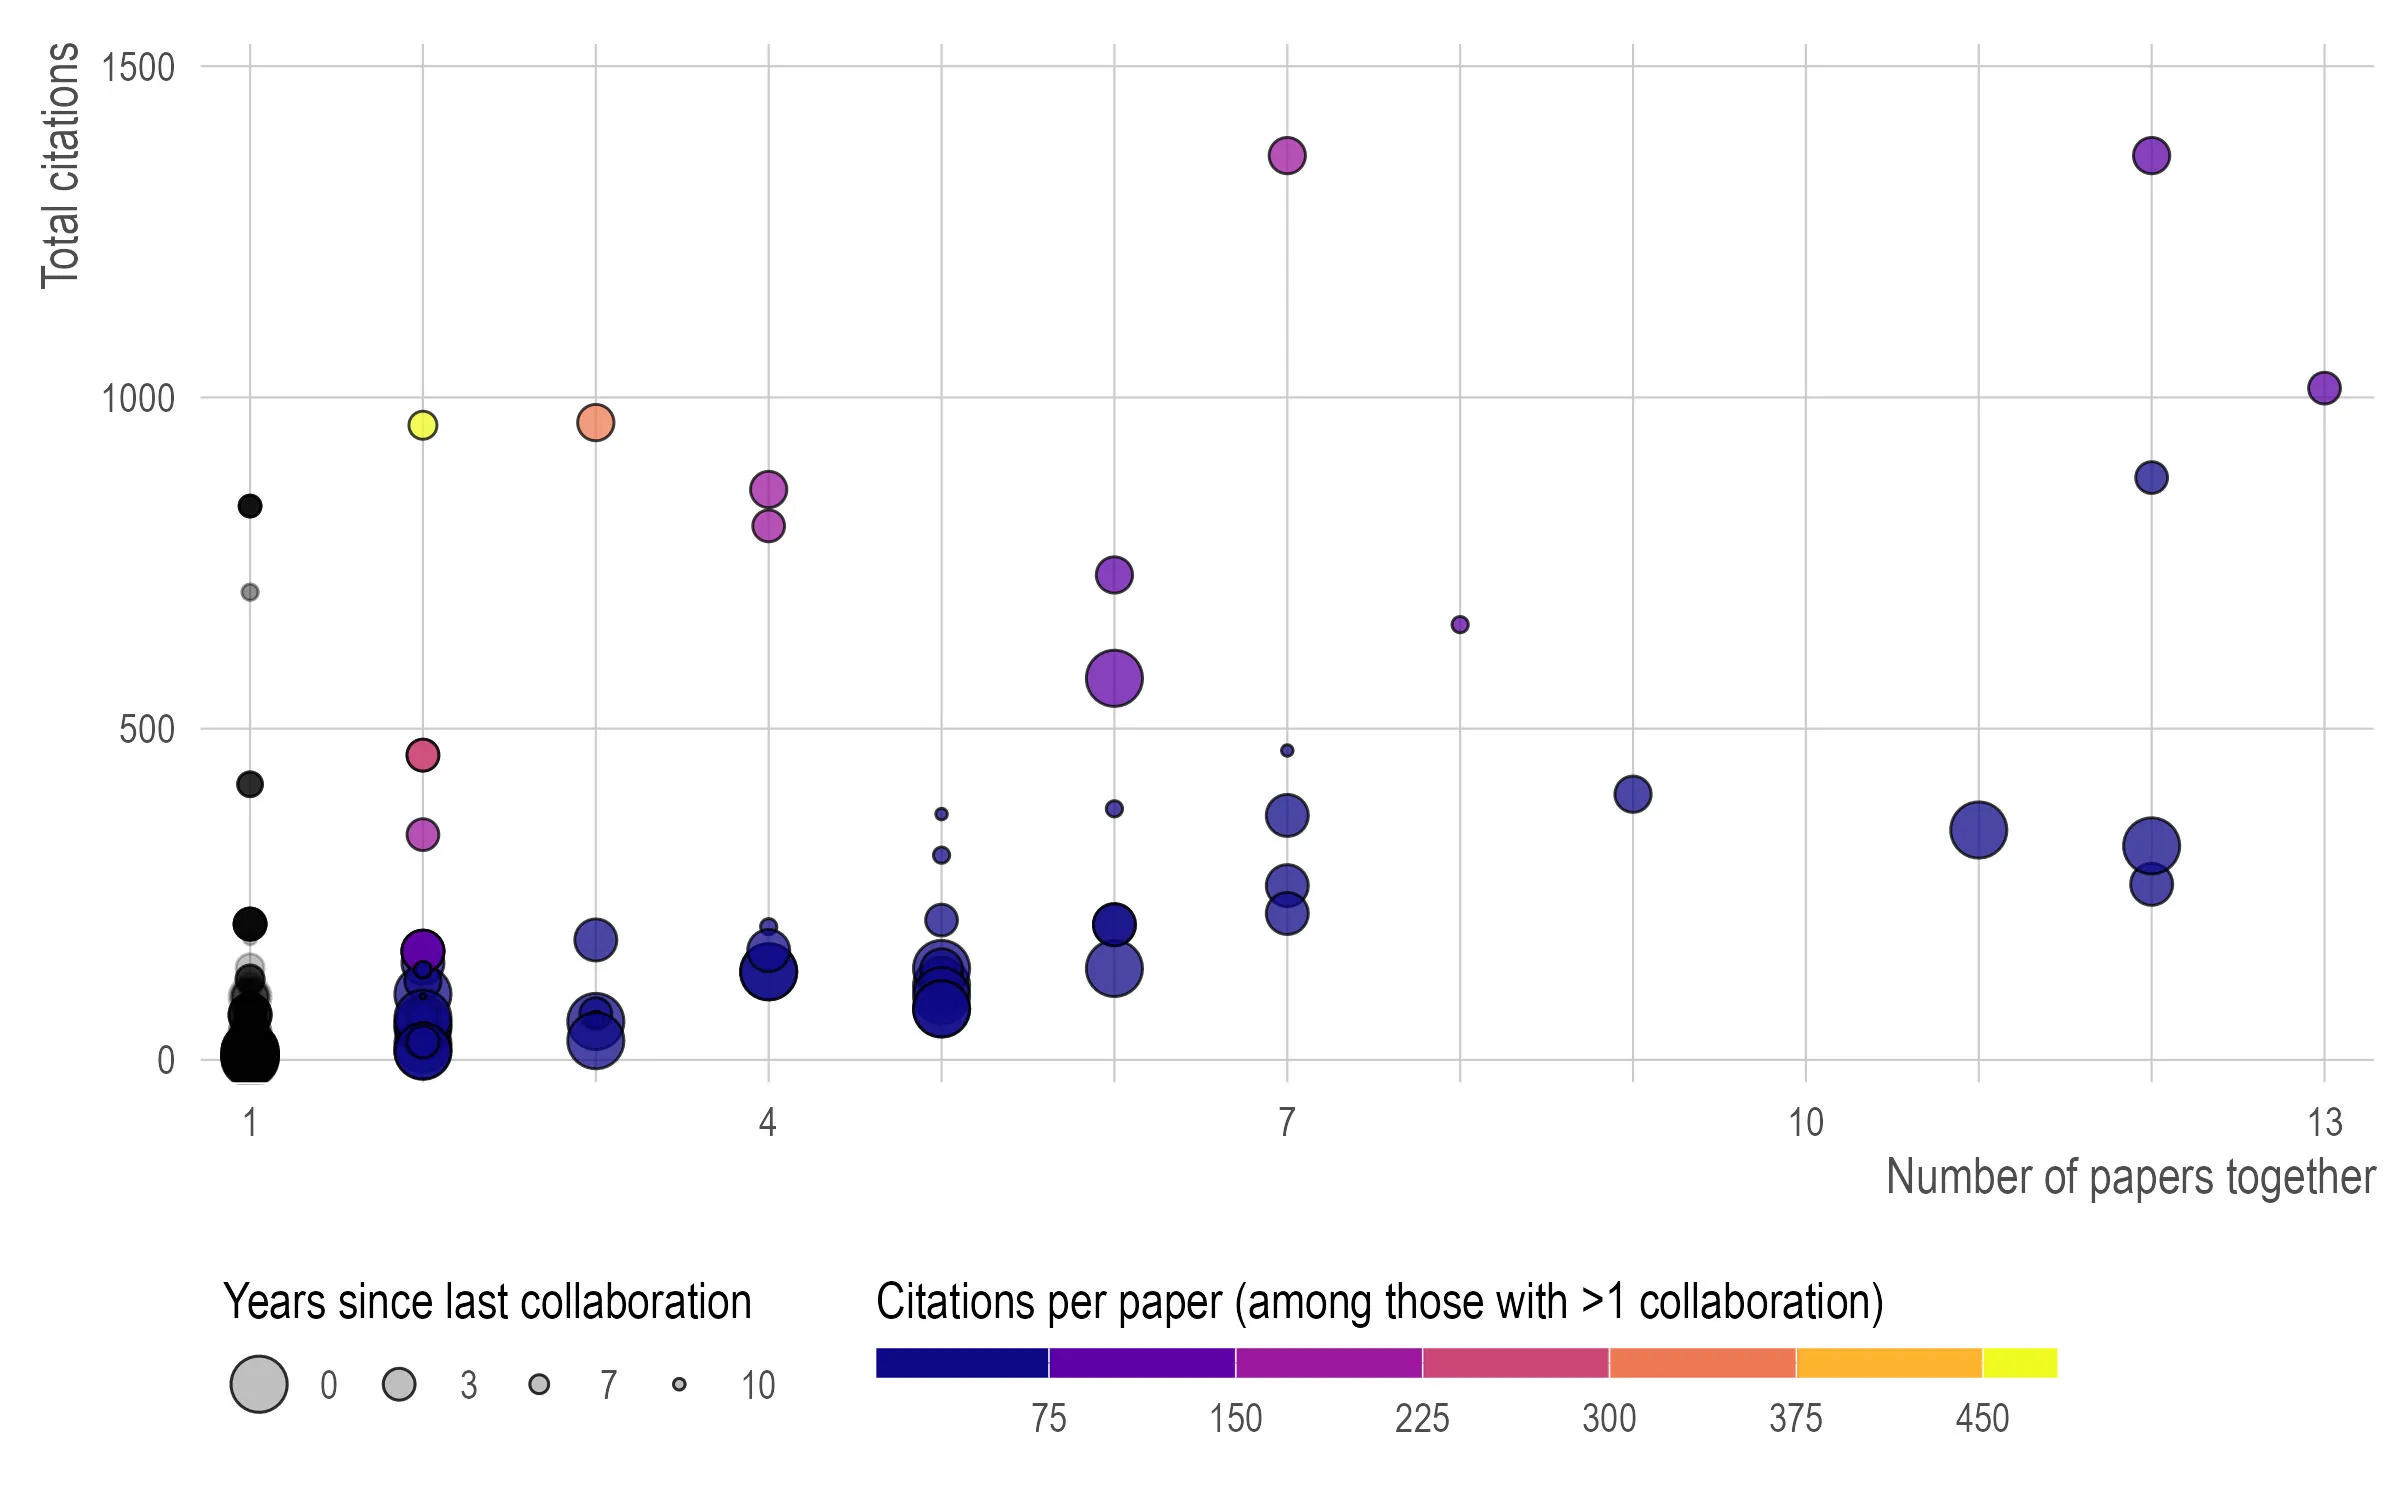
Conditional on having more than one collaboration together, who are my “most efficient” collaborators in terms of average number of citations? On the right are people I’ve written a lot with (Nancy Krieger, Jarvis Chen, and Caroline Buckee), while on the upper left are people I haven’t written a lot with but those papers got a lot of attention (Nishant Kishore and Rafa Irizarry).