My biking in 2023 vs 2022
Following up on my previous blogpost about my biking, here’s a quick update on how my biking went last year. My goals were flipped from last year — 2,500 miles outdoors (vs 1,500 miles outdoors last year) and 1,500 indoors (vs 2,500 miles indoors last year) and 100,000 feet of total elevation gain.
As you can see, I didn’t quite make either distance goal. I had a fairly bad bike crash in February that kept me off serious riding for about 8 weeks and any riding at all for 4 weeks. That said, I crushed my elevation goal and actually got to check off two really tough segments I’ve always wanted to complete: (1) Friends of Twin Peaks which is up and down Twin Peaks six different ways and (2) Hawk Hill 8x which is exactly what it sounds like, up and down Hawk Hill 8 times in a row.
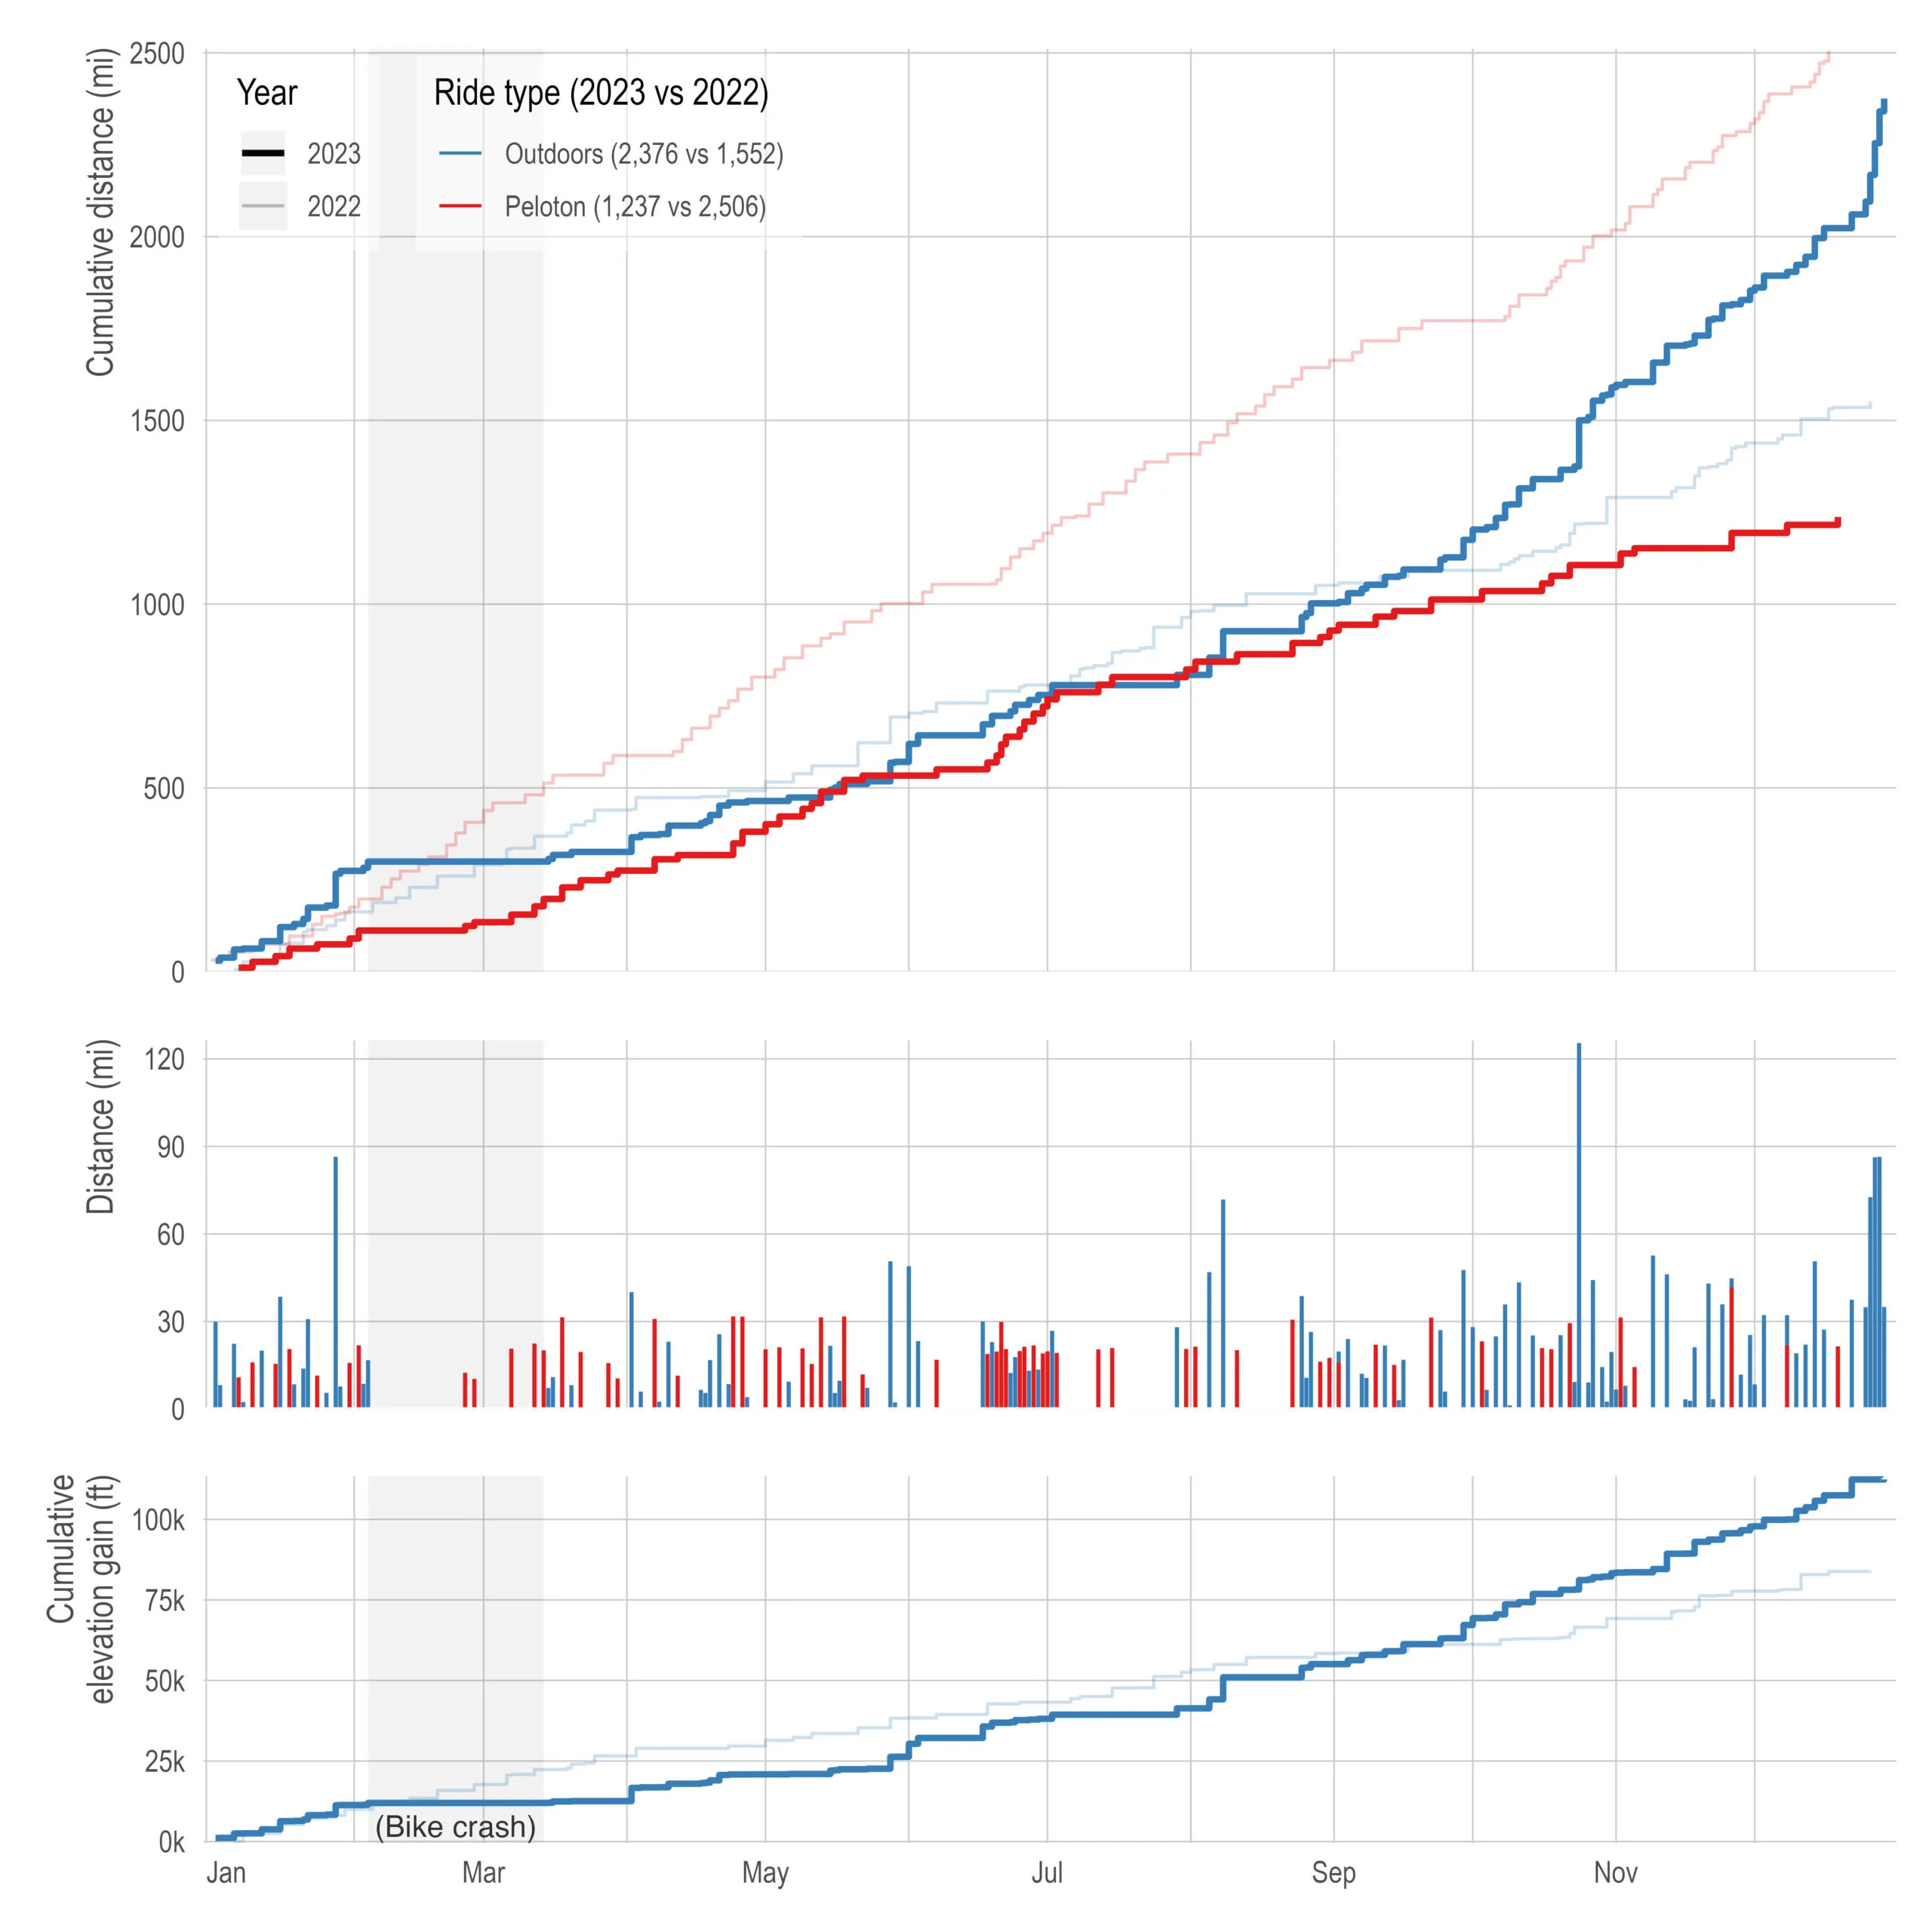
Despite not actually reaching either distance goal, I think it was a pretty good year. In addition to more climbing than last year (and finishing those two bucket list segments), I also attempted (and and completed) the Festive 500, which is a tradition where people ride 500km (310 miles) between Christmas Day and New Year’s Eve. The distance itself isn’t terrible at around 40-ish miles a day but it’s during a time with generally unpleasant weather and lots of social events. I wanted to try to make it extra spicy by seeing if I could do all in five consecutive days (childcare constraints) and only doing laps around the 0.68 mile long Golden Gate Park Polo Fields bike track. In some respects, doing it around the polo fields is easier — there are no lights, no car traffic, no hills, no pedestrians, etc. But because it is flat, there is also basically no coasting — if you’re out there, you are pedaling the entire time.
Here’s a plot of all my polo field laps, by day (color) compared to my non-Festive-500 polo field laps (black) by average speed (x-axis) and power (y-axis):
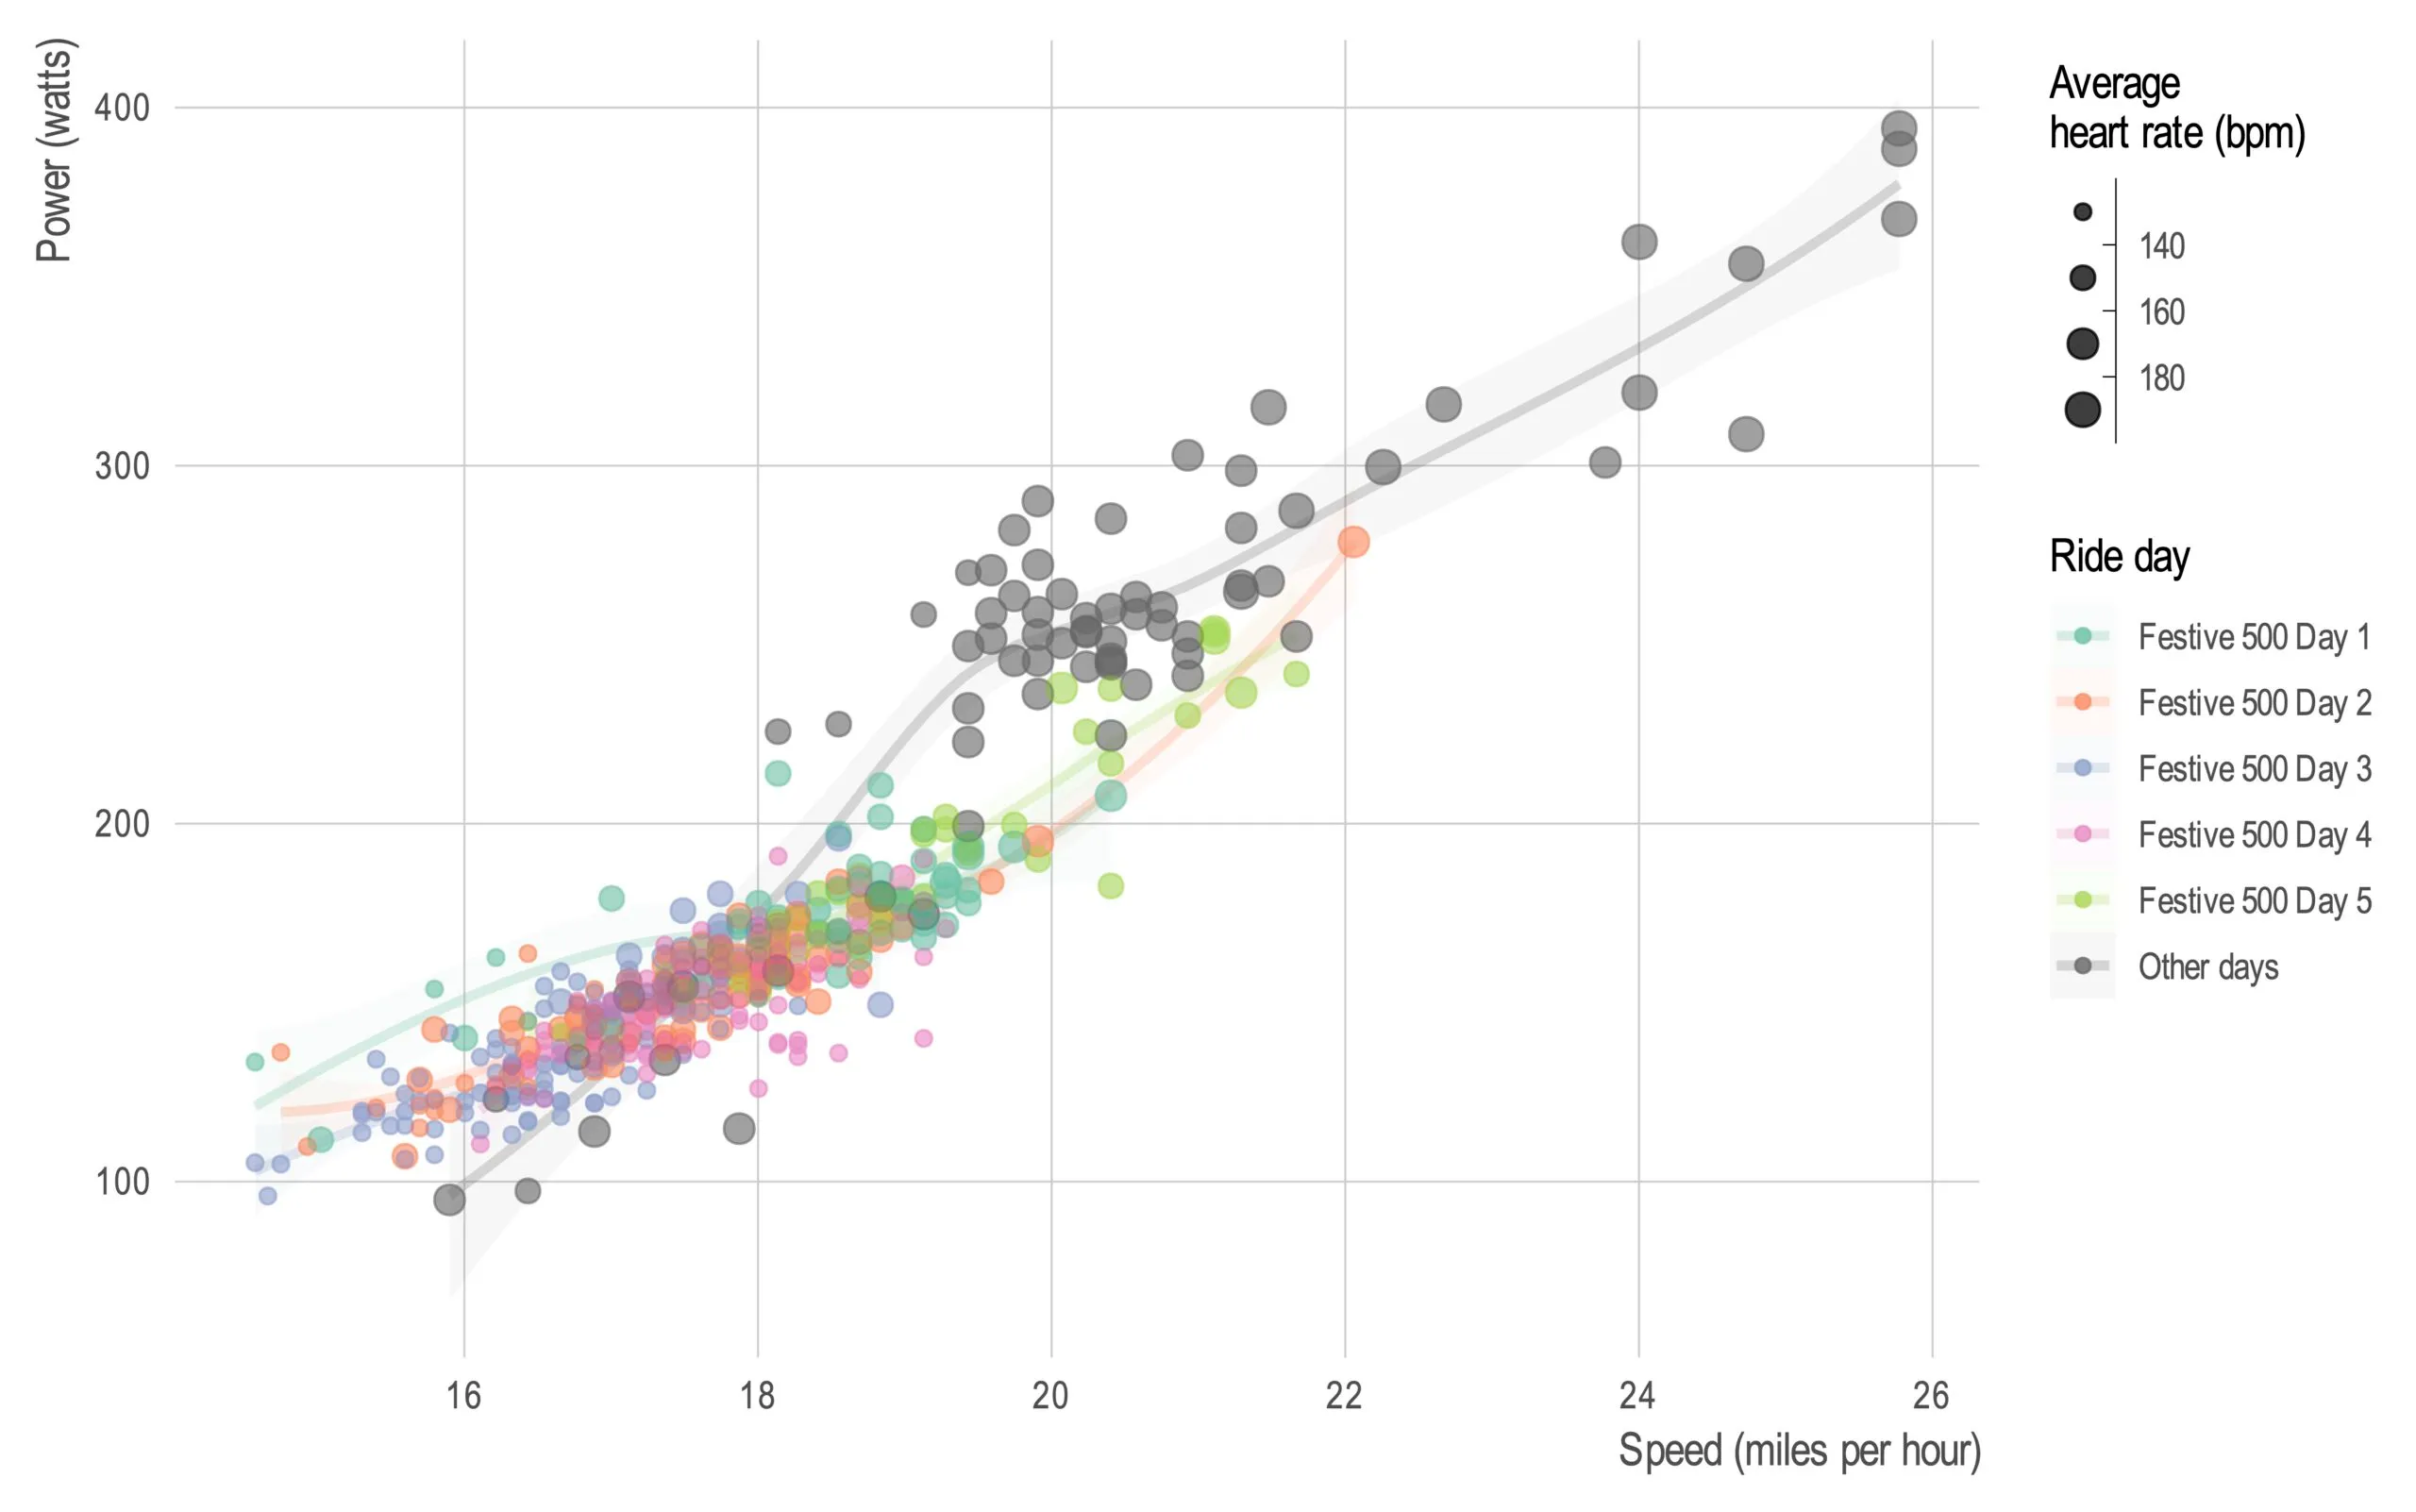
Most of the time, when I ride the polo fields, I do 2-10 laps at a time and it’s part of a different ride so I can spend a lot more energy (y-axis) which results in a faster average speed (x-axis). During the Festive 500 days, I was doing between 50-125 laps and was trying to be more conservative with my energy expenditure to make sure I made it through all five days.
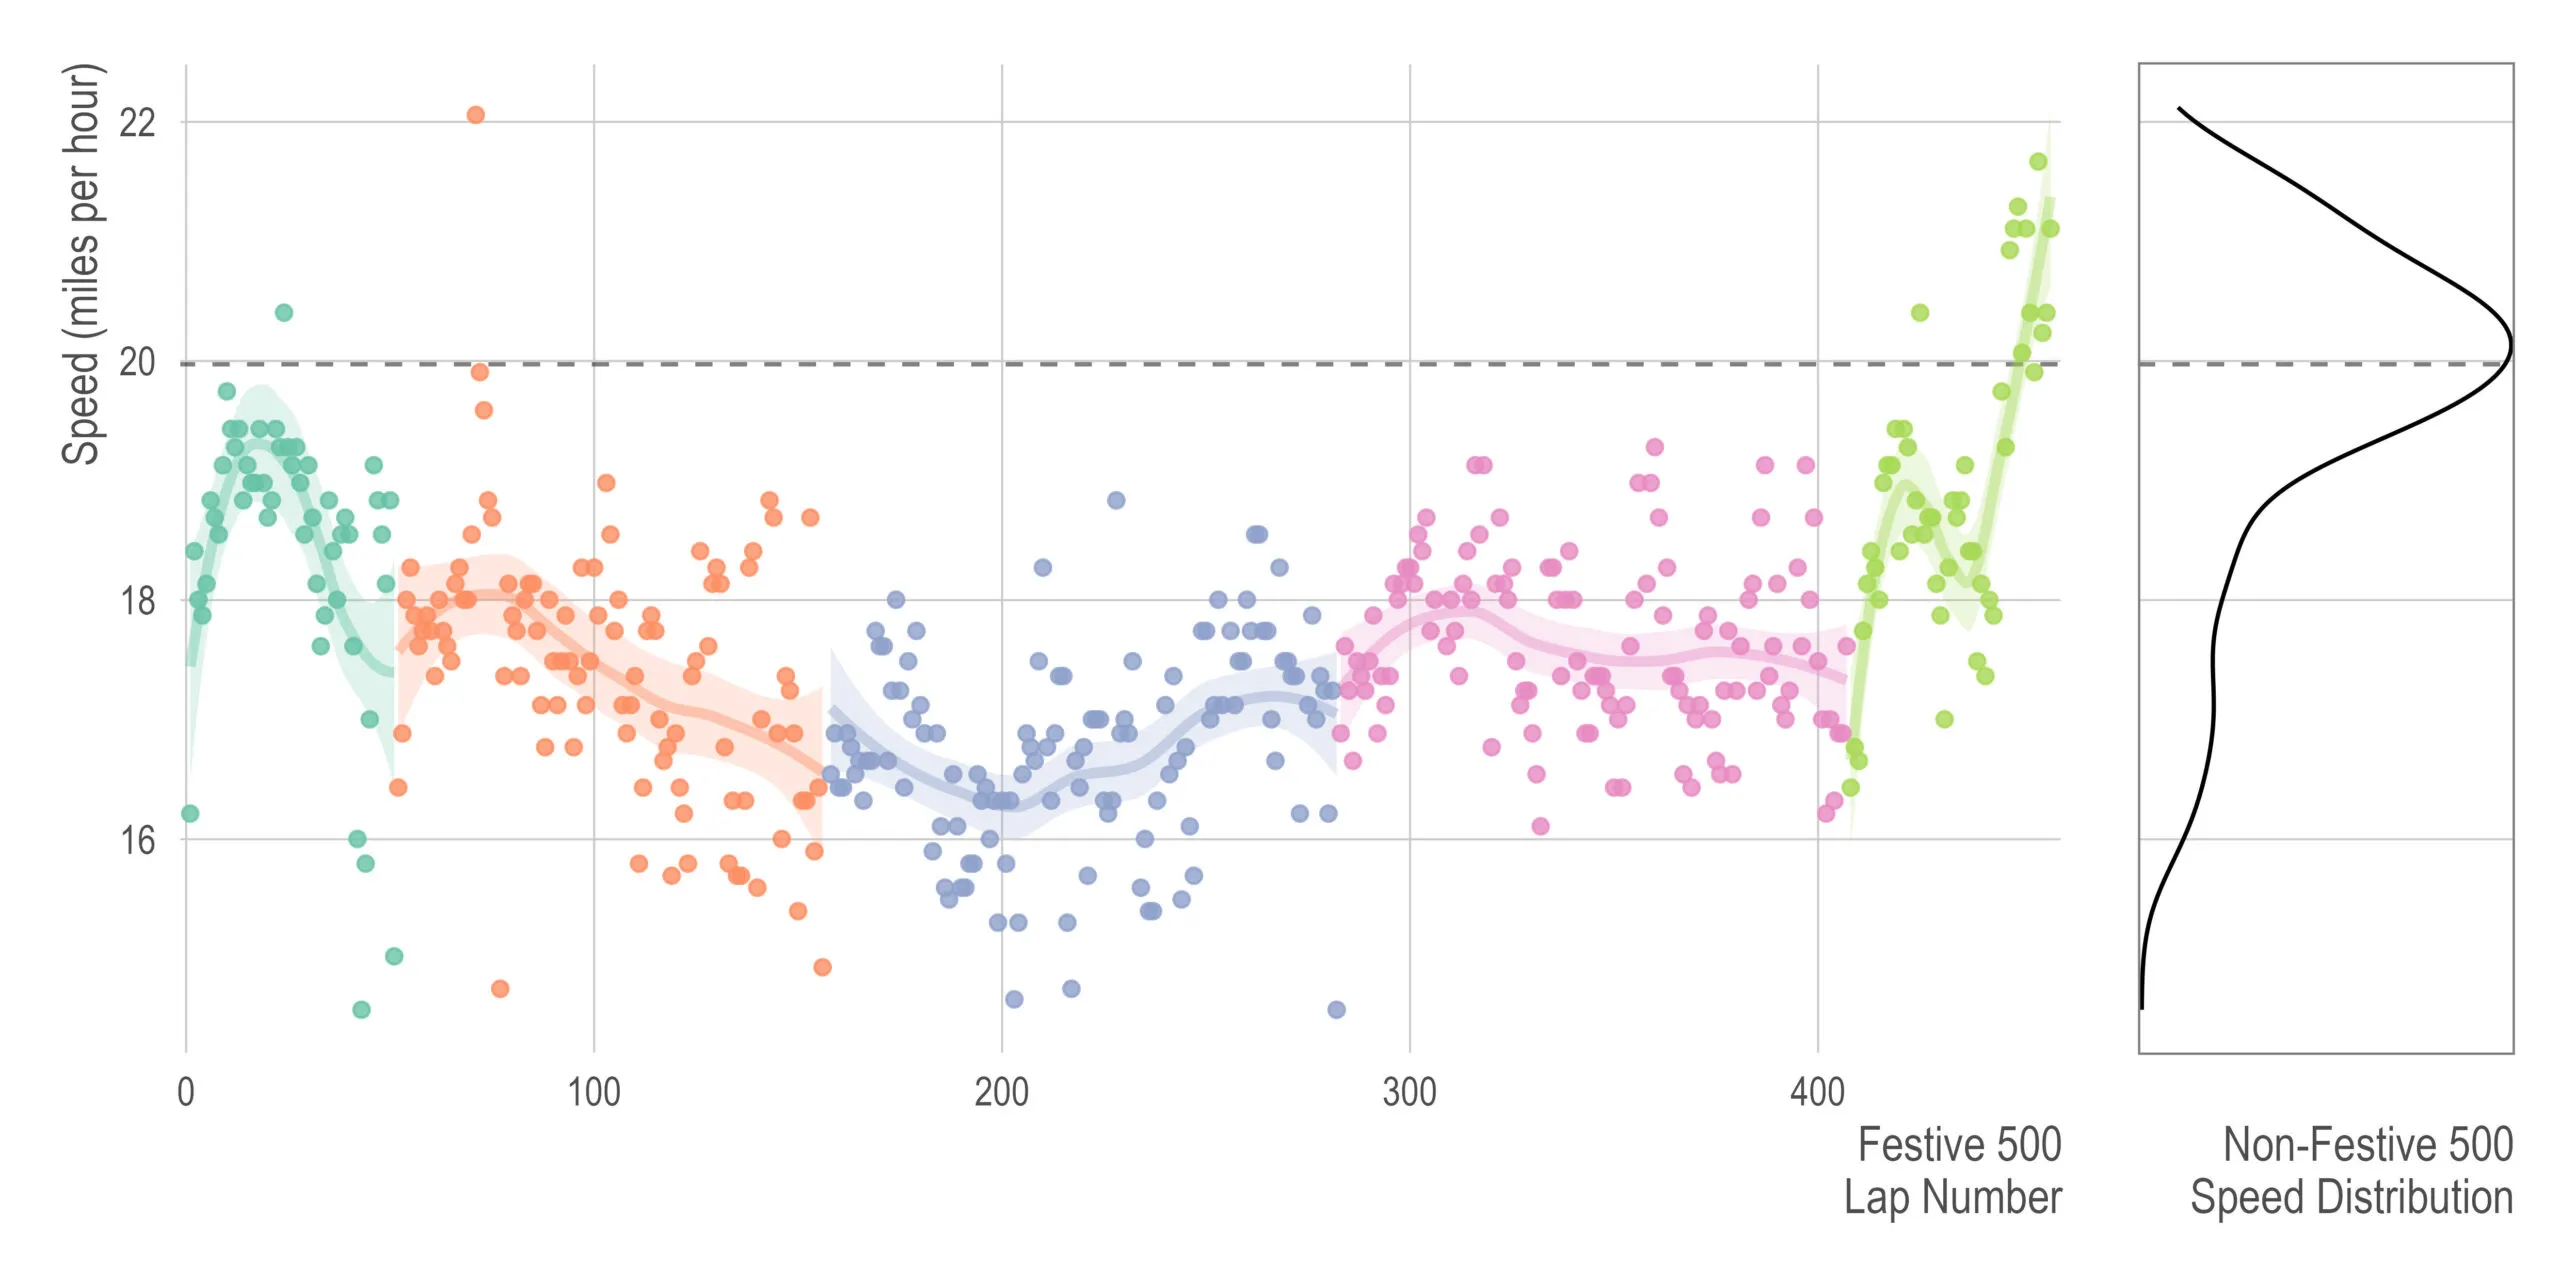
Above is the average speed (y-axis) of each lap (x-axis) across all five days (color). I mostly hung around the 17mph average, but you can clearly see on Day 5 when I realized I was being too conservative with my energy and had way too much gas left in the tank so I ramped up my speed. Days 3 and 4 were rainy and windy and generally pretty terrible and Day 1 I started off hot and then realized I wouldn’t be able to do that for another 456 laps so slowed down at the end.
Anyways, no moral of the story here. Missed my goals but they seemed pretty reasonably set so hopefully will get them this year.