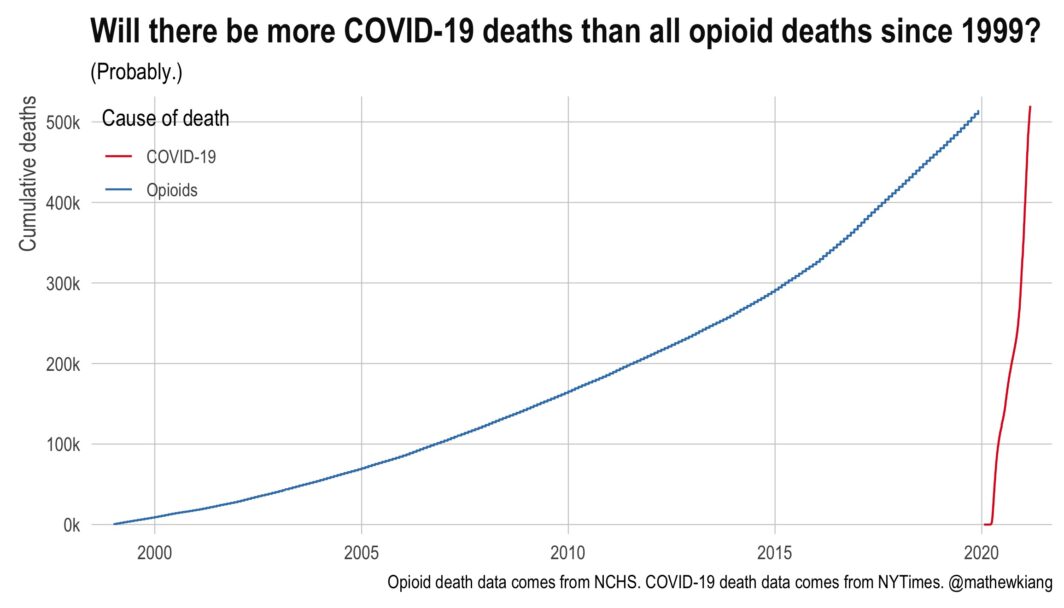
Using the CDC WONDER data for opioid deaths and the NYTimes data for COVID-19, I show the cumulative deaths (y-axis) from all opioids (blue) and from COVID (red) over time (x-axis).
UPDATE: On March 2, 2021, the US has had more confirmed COVID-19 deaths than all opioid-related deaths 1999 to 2019. My back-of-the-envelope estimates suggests we will easily pass the 2020 opioid-related deaths by the end of April.
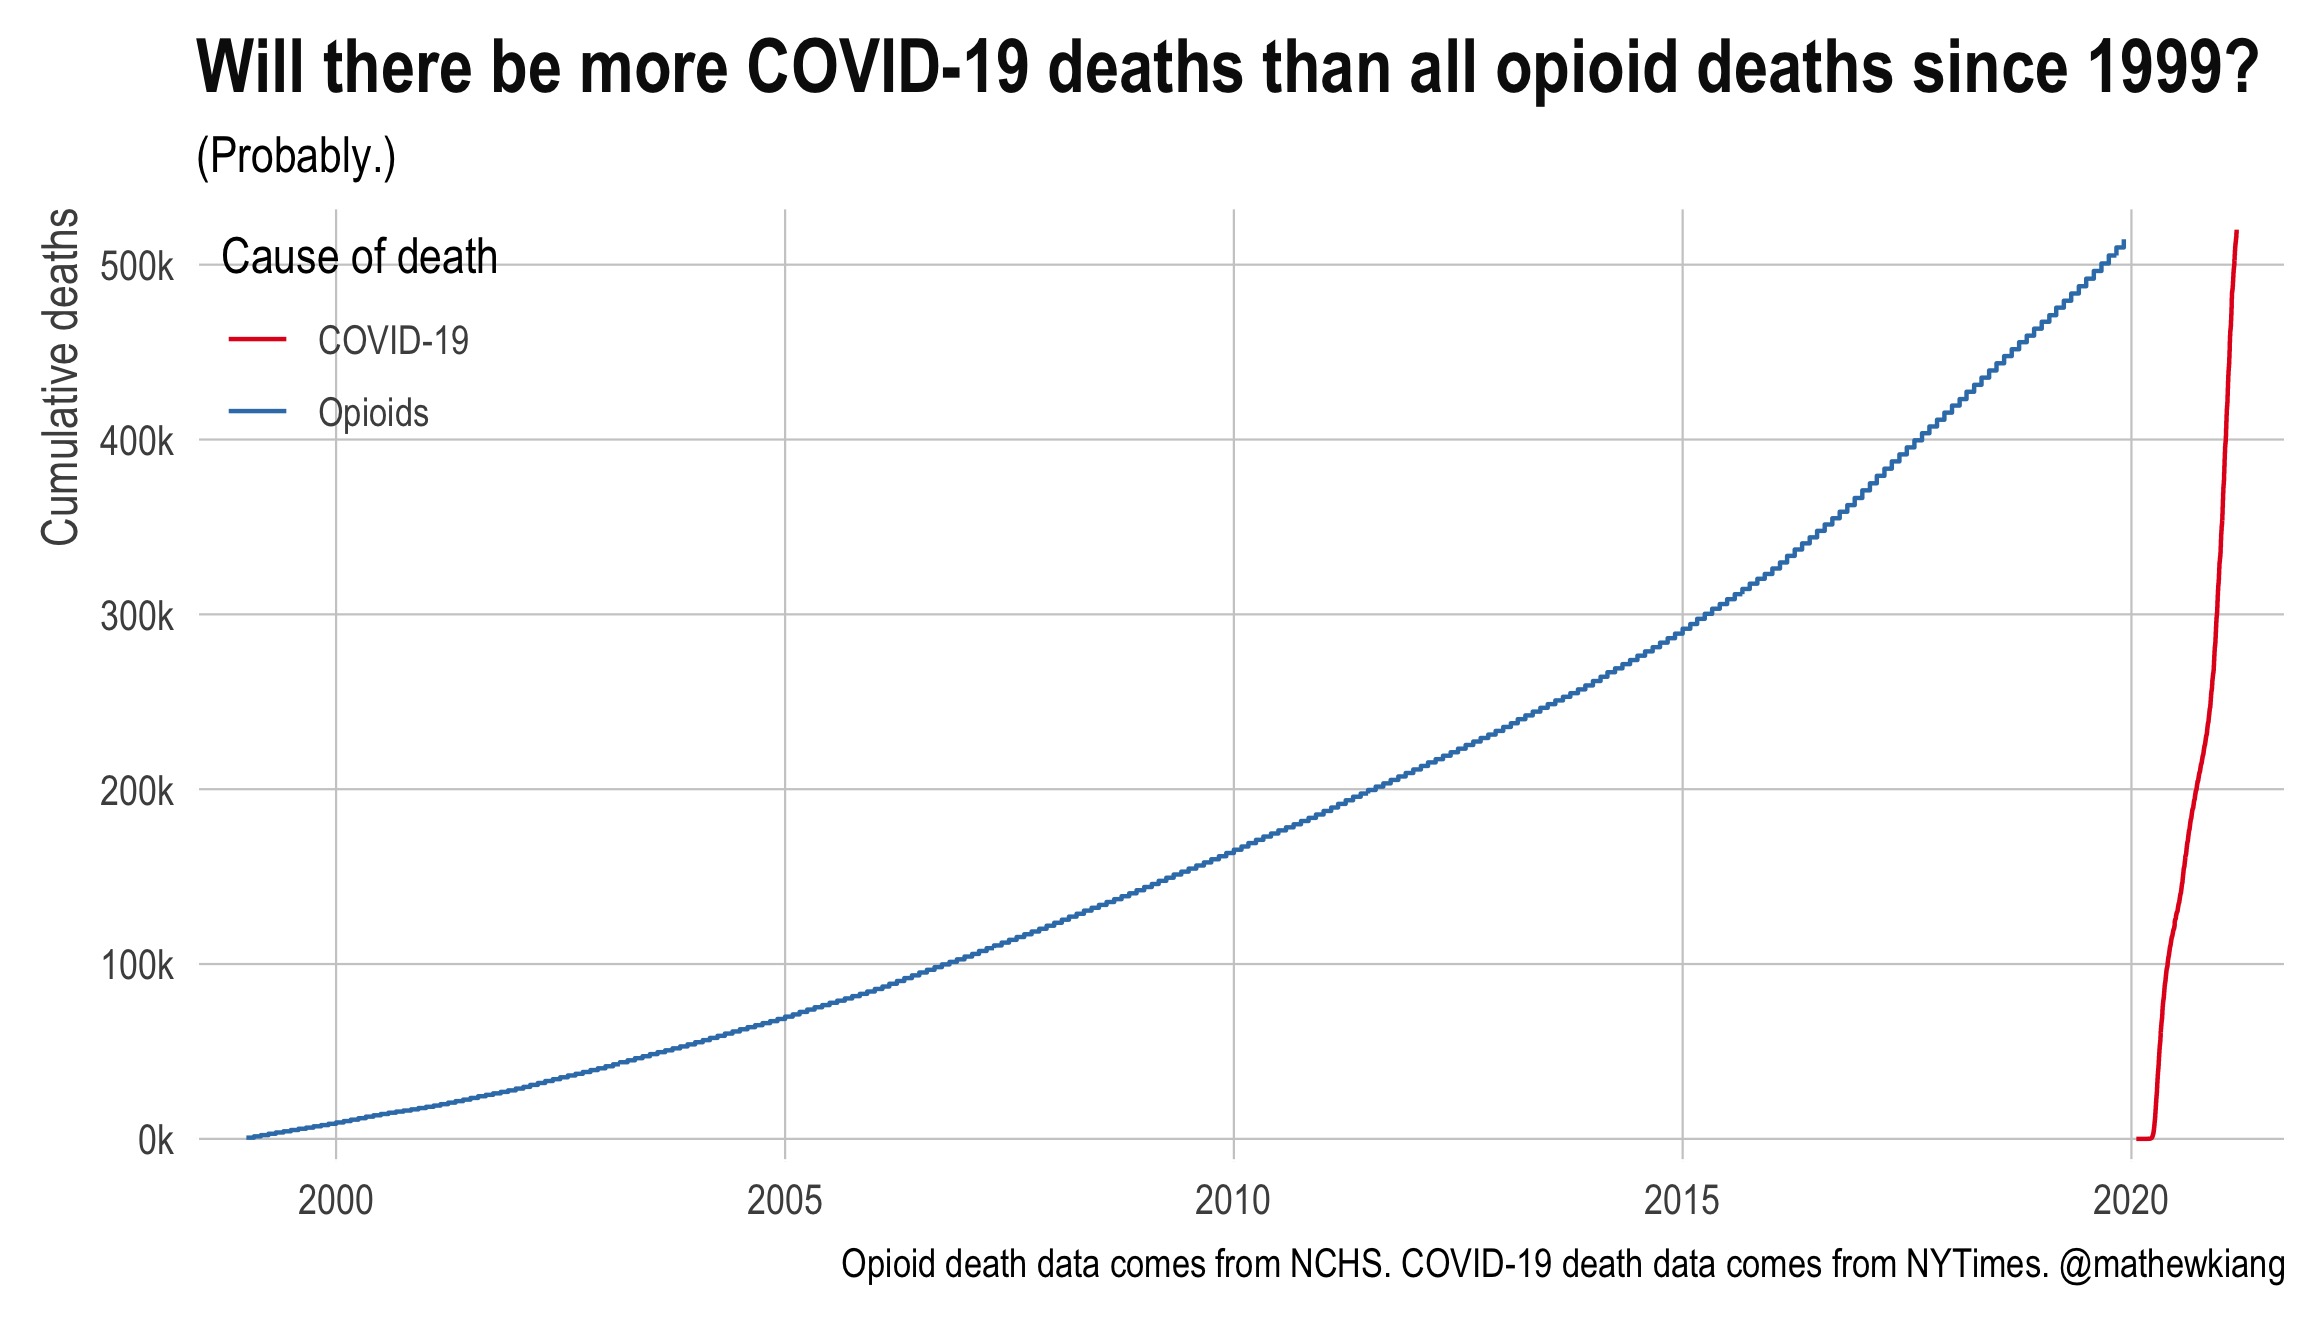
I’ll be updating this periodically. Last updated: 3/5/2021.