Our new paper about opioid prescribing patterns in the US
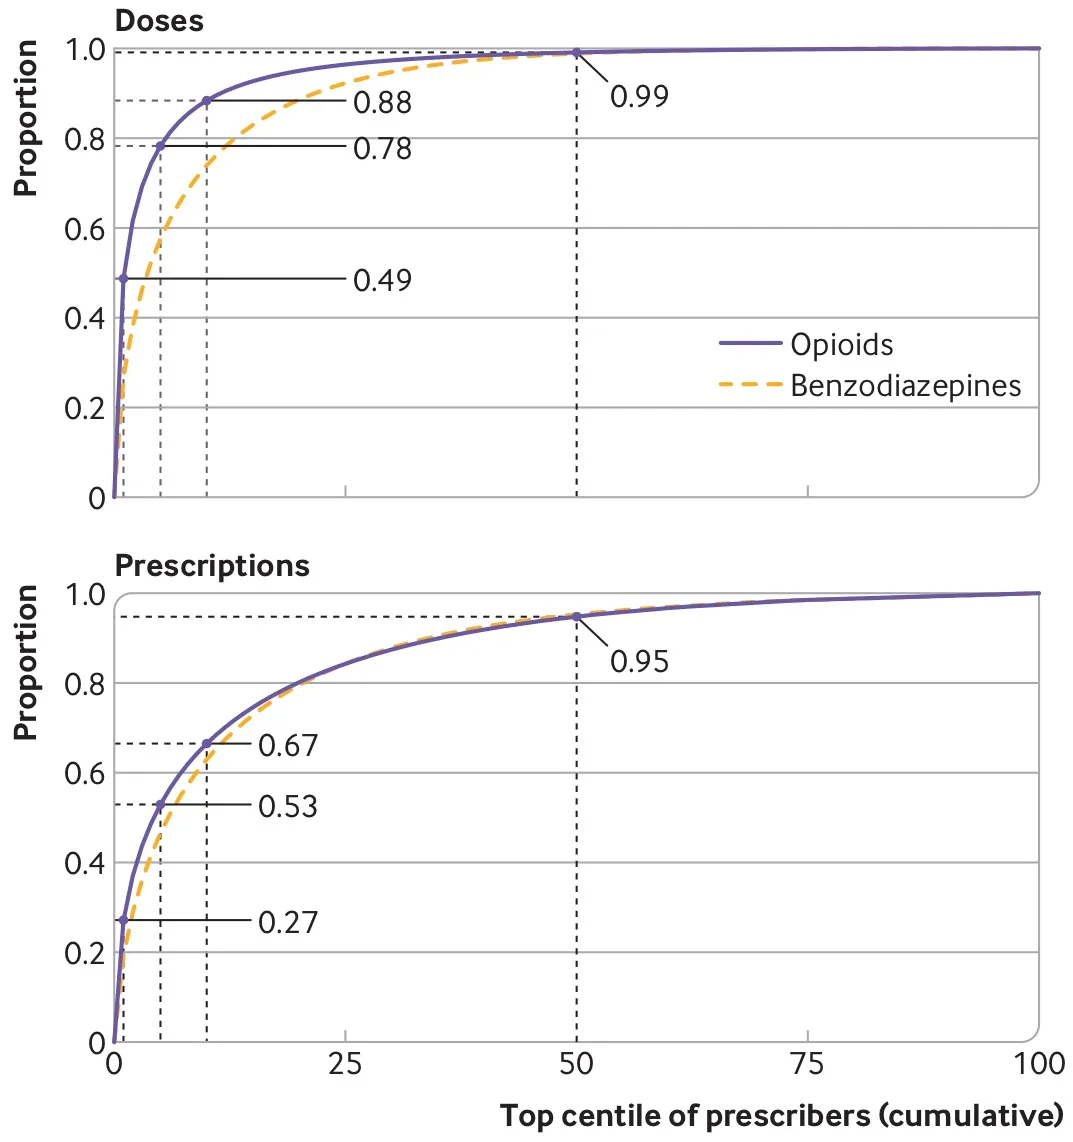
Some notes about a new (open access) paper with Keith Humphreys, Mark Cullen, and Sanjay Basu — “Opioid prescribing patterns among medical providers in the United States, 2003-17: retrospective, observational study” — just published in BMJ.
- Reproducible code is available on the official paper Github repository. I don’t plan to make any changes, but just in case, the first release is the version of the code used to produce the manuscript.
- We’ve created a handful of Shiny apps for interested readers. What we present in the paper is only a tiny sliver of all the results — additional results by drug, sensitivity analyses, outcome, and geography are available through the apps.
- Despite our best efforts, we were not able to share the aggregated (proprietary) data. However, we’ve created a mechanism for other researchers to access the data through Stanford’s Center for Population Health Science’s Data Core. (Approval from an Optum representative is still required — see the Github repo for details.)
- In addition, we’ve created a mechanism for researchers to get access to the raw data for a fee to reproduce our entire analysis from start to finish.
- As with most BMJ papers, the peer review reports are open and publicly accessible.